Gold Price Forecast: XAU/USD bears eye $1,925 as US Dollar, yields rise amid debt ceiling woes
4 min read
- Gold price bears the burden of firmer United States Treasury bond yields, US Dollar.
- US debt ceiling talks’ impasse, hawkish Federal Reserve talks allow T-bond yields, USD to grind higher, weigh on XAU/USD.
- Risk catalysts, second-tier US data eyed for clear directions of the Gold Price.
Gold Price (XAU/USD) remains pressured at weekly low, surrounding the key support juncture, as bears keep the reins around $1,957 during early Thursday in Asia. In doing so, the bright metal bears the burden of the firmer United States Treasury bond yields and the US Dollar amid market’s fears of the US default, as well as indecision about the Federal Reserve’s (Fed) next move.
Gold Price drops on United States default fears
Gold price holds onto its bearish trajectory and is likely to register the third consecutive weekly loss amid fears that the United States policymakers won’t be able to avoid the ‘catastrophic’ default. Adding strength to the XAU/USD’s downside is the indecision surrounding the Federal Reserve’s (Fed) next move.
On Wednesday, US House Speaker Kevin McCarthy said that they are sending their negotiators to the White House to try and finish up debt-limit talks. On the same line, US Treasury Secretary Janet Yellen said that they will try to increase the level of precision on the date and noted that there will be some obligations that they will not be able to pay. Also reports took rounds that the US House members will go back to their homes after Thursday, to cheer the long weekend, before resuming the debt ceiling negotiations, which in turn will escalate the fears of no deal before late May.
On the other hand, the Minutes of the latest Federal Open Market Committee (FOMC) Meeting suggested that the policymakers aren’t on the same table as some suggest it is appropriate to hike the rates while others advocate for a policy pivot.
Recently, Federal Reserve (Fed) Bank of Atlanta President Raphael Bostic said, “‘We’re right at the beginning of the hard part’ of taming inflation.” On the same line, Federal Reserve Governor Christopher Waller mentioned that he doesn’t support stopping rate hikes unless getting clear evidence that inflation is moving down towards 2% objective.
Against this backdrop, the US Dollar Index (DXY) rose for the third consecutive day to mark the highest levels since March 20 while the benchmark US Treasury bond yields also rose to the mid-March highs. That said, Wall Street closed in the red and the same exerted downside pressure on the Gold price.
Moving on, the US weekly Jobless Claims, the second reading of the Q1 GDP estimate, the Chicago Fed National Activity Index and Pending Home Sales are on the economic calendar to entertain the Gold traders. However, major attention will be given to the United States debt ceiling drama for clear directions.
Gold Price Technical analysis
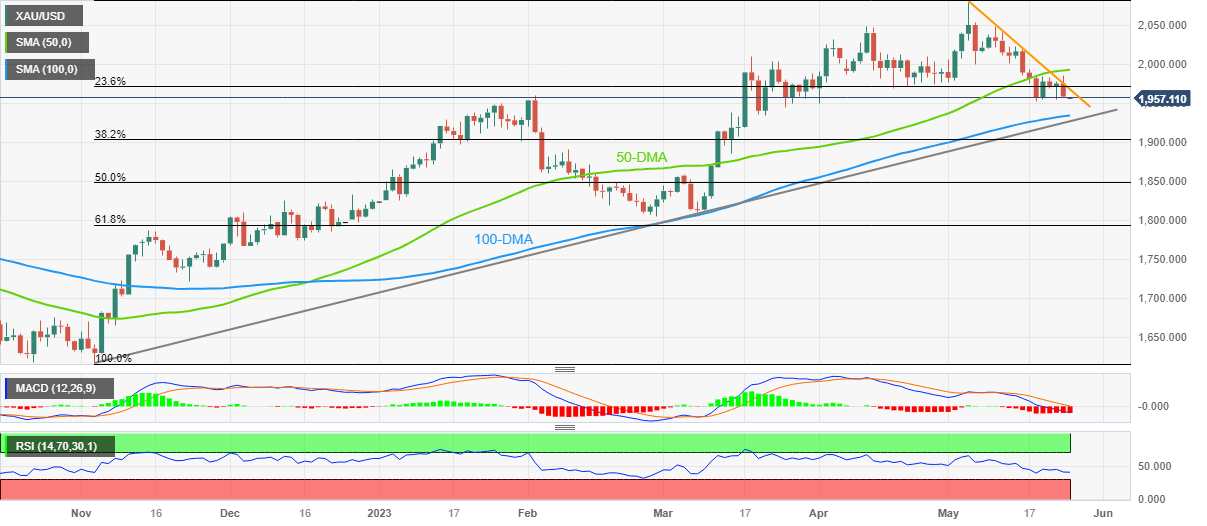
Gold price extends pullback from a three-week-old descending resistance line as it prods the monthly low of around $1,952, quickly followed by January’s peak of around $1,950.
It’s worth noting that the XAU/USD’s sustained trading below the 50-DMA joins the bearish signals from the Moving Average Convergence and Divergence (MACD) indicator to keep the sellers hopeful. However, the below 50.0 levels of the Relative Strength Index (RSI) line, placed at 14, suggests limited downside room for the quote.
As a result, the odds of the Gold price rebound from the 100-DMA support of $1,933, in case the quote breaks the $1,950 support, are higher. If at all the XAU/USD breaks the 100-DMA support, an upward-sloping support line from early November, close to $1,924, will be the key to watch for clear directions.
On the contrary, a daily closing beyond the stated resistance line of near $1,968 needs validation from the 50-DMA resistance of $1,992, as well as the $2,000 round figure, to convince the Gold buyers.
Even so, April’s high of $2,048 and the $2,050 round figure may prod the XAU/USD upside before challenging the record top marked earlier in the month around $2,080.
Overall, the Gold price remains on the bear’s radar below the $2,000 mark but the downside room appears limited.
Gold price: Daily chart
Trend: Further downside expected
ADDITIONAL IMPORTANT LEVELS
| OVERVIEW | |
|---|---|
| Today last price | 1957.11 |
| Today Daily Change | -18.10 |
| Today Daily Change % | -0.92% |
| Today daily open | 1975.21 |
| TRENDS | |
|---|---|
| Daily SMA20 | 2002.67 |
| Daily SMA50 | 1990.96 |
| Daily SMA100 | 1931.91 |
| Daily SMA200 | 1827.68 |
| LEVELS | |
|---|---|
| Previous Daily High | 1977.81 |
| Previous Daily Low | 1954.28 |
| Previous Weekly High | 2022.18 |
| Previous Weekly Low | 1952.01 |
| Previous Monthly High | 2048.75 |
| Previous Monthly Low | 1949.83 |
| Daily Fibonacci 38.2% | 1968.82 |
| Daily Fibonacci 61.8% | 1963.27 |
| Daily Pivot Point S1 | 1960.39 |
| Daily Pivot Point S2 | 1945.57 |
| Daily Pivot Point S3 | 1936.86 |
| Daily Pivot Point R1 | 1983.92 |
| Daily Pivot Point R2 | 1992.63 |
| Daily Pivot Point R3 | 2007.45 |