Gold Price Forecast: XAU/USD bears occupy driver’s seat on hawkish Fed bets, US default jitters
4 min read
- Gold Price appears well set for third consecutive weekly loss.
- Strong United States data, hawkish Federal Reserve talks favor US Dollar, weighs on XAU/USD.
- Escalating fears of US debt ceiling expiration also favor Gold bears as policymakers struggle for a deal.
- Multiple US statistics lined up to direct intraday Gold Price, risk catalysts are the key.
Gold Price (XAU/USD) remains on the back foot at the two-month low surrounding $1,941 amid early Friday morning in Asia and remains pressured around the lowest levels since late March after falling in the last two consecutive days. The yellow metal’s weakness could be linked to the market’s risk-off mood and upbeat United States data ahead of a slew of the US statistics, which in turn favor the US Dollar’s strength.
Gold Price drops as firmer US data, risk-aversion underpins US Dollar, yields
Gold Price witnesses heavy downside pressure as it braces for the third consecutive weekly loss amid broadly firmer United States statistics and fears of the US default. In doing so, the XAU/USD justifies firmer US Dollar and Treasury bond yields.
Talking about the United States statistics, the second estimation of the US Annualized Gross Domestic Product (GDP) for Q1 2023 was revised up to 1.3% versus 1.0% first forecasts. Further, the Chicago Fed National Activity Index for April improved to 0.07 from -0.37 prior and -0.02 market estimations. On the same line, Kansad Fed Manufacturing Activity improved to -2 for May compared to -21 previous readings and analysts’ estimations of -11. It’s worth noting that the US Pending Home Sales for April improved on YoY but eased on MoM whereas Core Personal Consumption Expenditures also rose to 5.0% during the preliminary readings versus 4.9% prior.
Following the data, Richmond Fed President Thomas Barkin said, “Fed is in a test and learn situation to determine how slowing demand lowers inflation.” On the different front, Boston Federal Reserve President Susan Collins said on Thursday that the Fed “may be at or near” the time to pause interest rate increases, as reported by Reuters.
Given the firmer US data and mostly hawkish Federal Reserve (Fed) comments, the US Dollar and Treasury bond yields grind higher, which in turn weighs on the Gold Price ahead of a slew of the US statistics relating to the activity and inflation.
Apart from the US data and Fed talks, the concerns about USpolicymakers’ inability to clinch a deal on the US debt ceiling extension, as well as the latest chatters suggesting a $70.0 gap left to be filled by the negotiators to get the much-awaited deal also weigh on the XAU/USD prices, via the firmer US Dollar and yields.
That said, the US Dollar Index (DXY) rose to the highest levels in 10 weeks, to 104.20 at the latest, whereas the US 10-year and two-year Treasury bond yields rose to the early March highs of around 3.82% and 4.54% in that order.
Moving on, the Gold price remains vulnerable to the further downside amid the market’s rush for the haven demand and hawkish Federal Reserve bets, backed by upbeat US data and US debt ceiling talks. Talking about the data, US Durable Goods Orders for April and the Core Personal Consumption Expenditure (PCE) Price Index for the said month, known as the Fed’s preferred inflation gauge, will also be important to watch for clear directions. Above all, risk catalysts are the key.
Gold Price technical analysis
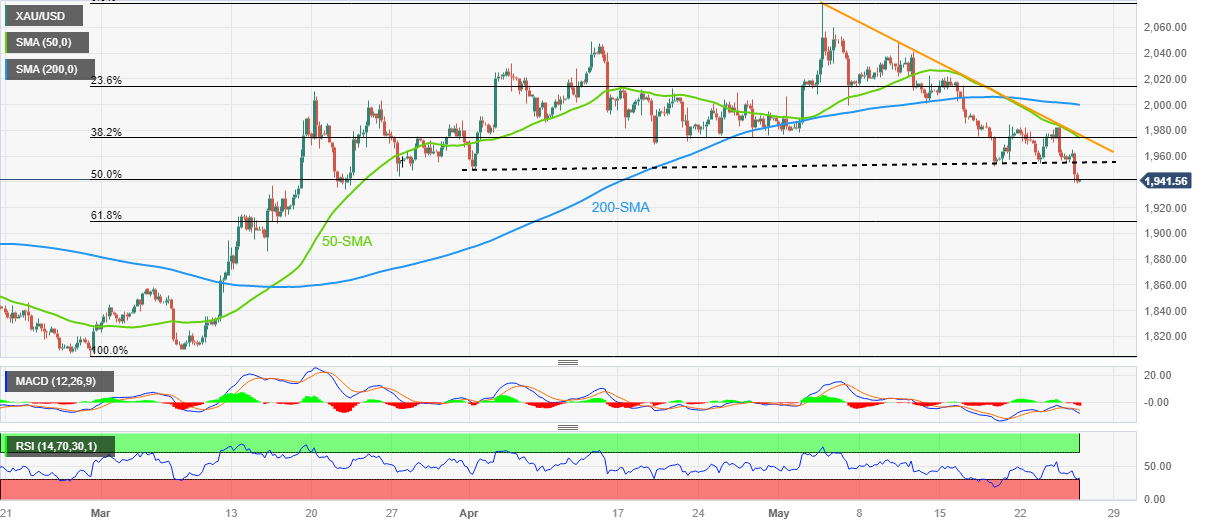
Gold price prods two-month low on breaking the key support line stretched from early April, now immediate resistance around $1,956.
Adding strength to the XAU/USD downside bias are the bearish signals from the Moving Average Convergence and Divergence (MACD) indicator and the metal’s sustained trading below the 50-SMA, as well as the monthly resistance line, currently joining around $1,975.
It’s worth noting, however, that the oversold conditions of the Relative Strength Index (RSI) line, placed at 14, allow the Gold price to rebound from the 61.8% Fibonacci retracement of its February-May upside, near $1,909.
Following that, the mid-March swing low of near $1,85 can act as the last defense of the Gold buyers.
On the contrary, the aforementioned resistances around $19,56 and $1,975 may prod the XAU/USD bulls before giving them control.
Even so, the 200-SMA near the $2,000 psychological magnet and the previous monthly high surrounding $2,050 can challenge the upside momentum of the Gold price before directing it to the record high of $2,080.
Overall, the Gold price is likely to drop further but the road towards the south appears bumpy.
Gold Price: Four-hour chart
Trend: Further downside expected
ADDITIONAL IMPORTANT LEVELS
| OVERVIEW | |
|---|---|
| Today last price | 1941.37 |
| Today Daily Change | -15.74 |
| Today Daily Change % | -0.80% |
| Today daily open | 1957.11 |
| TRENDS | |
|---|---|
| Daily SMA20 | 2001.08 |
| Daily SMA50 | 1992.02 |
| Daily SMA100 | 1933.1 |
| Daily SMA200 | 1828.59 |
| LEVELS | |
|---|---|
| Previous Daily High | 1985.3 |
| Previous Daily Low | 1956.79 |
| Previous Weekly High | 2022.18 |
| Previous Weekly Low | 1952.01 |
| Previous Monthly High | 2048.75 |
| Previous Monthly Low | 1949.83 |
| Daily Fibonacci 38.2% | 1967.68 |
| Daily Fibonacci 61.8% | 1974.41 |
| Daily Pivot Point S1 | 1947.5 |
| Daily Pivot Point S2 | 1937.89 |
| Daily Pivot Point S3 | 1918.99 |
| Daily Pivot Point R1 | 1976.01 |
| Daily Pivot Point R2 | 1994.91 |
| Daily Pivot Point R3 | 2004.52 |