Gold Price Forecast: XAU/USD remains lackluster below $2,020 with eyes on US debt-ceiling issues
2 min read
- Gold price is sideways below $2020.00 as investors await the US debt-ceiling talks’ outcome for further action.
- US President Joe Biden aims for closing the argument with approval for a higher borrowing cap without impacting spending initiatives’ budget.
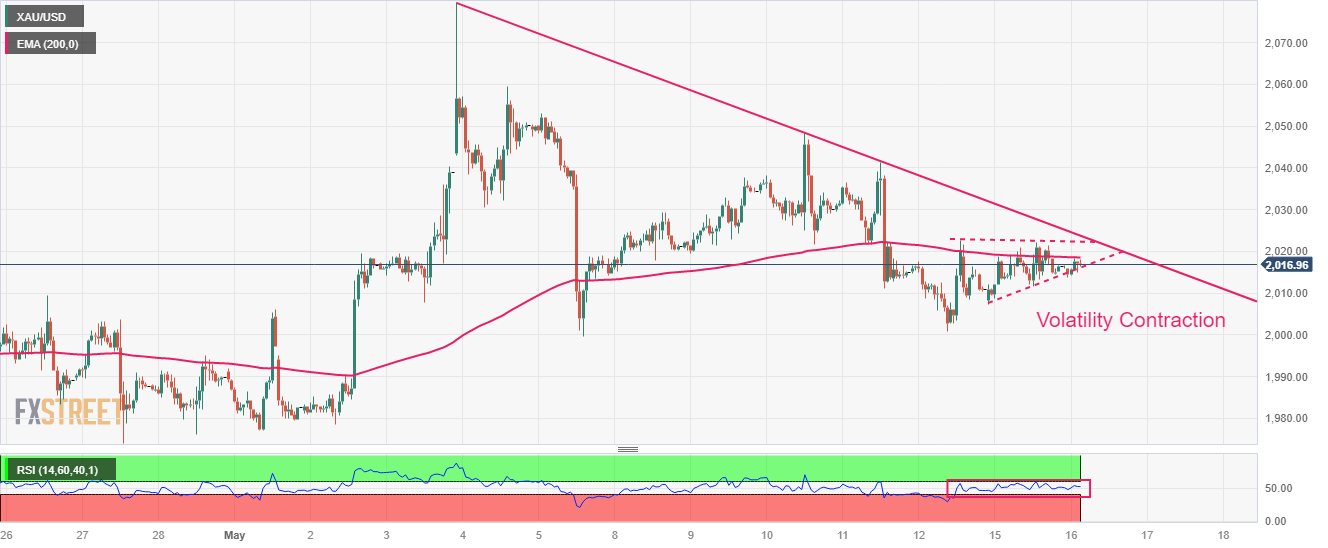
- Gold price is forming a volatility contraction pattern around $2,020.00, which indicates a back-and-forth action.
Gold price (XAU/USD) is continuously delivering a sideways performance as investors are looking for potential cues for decisive action. The precious is showing sideways auction below $2,020.00 ahead of the outcome of United States debt-ceiling talks between Republican leaders and the White House.
Postponed Friday’s meeting is scheduled for Tuesday and a volatile action in the FX domain cannot be ruled out. No doubt, US President Joe Biden will work on closing the argument with approval for a higher borrowing cap for the US Treasury without surrendering budget’ spending initiatives. However, House of Representatives Joseph McCarthy would also attempt for reducing spending to avoid further budget deficits.
The US President is highly needed to raise debt-ceiling to avoid default on obligated payments as it would harm the United States leadership positions and the economy’s credibility.
S&P500 futures have reported some losses in Asia as investors are worried about the scenario if the debt-ceiling negotiations conclude without a meaningful outcome. The US Dollar Index (DXY) has retreated after a recovery attempt below 102.40. Going forward, US Retail Sales data will also remain in the limelight as it would provide more clarity on monetary policy guidance. Largely, the Federal Reserve (Fed) is expected to keep the interest rate policy steady in June’s monetary policy meeting.
Gold technical analysis
Gold price is forming a volatility contraction pattern around $2,020.00 on an hourly scale, which indicates a back-and-forth action. However, an explosion in the same results in wide ticks and heavy volume. The downward-sloping trendline plotted from all-time highs at May 03 high at $2,079.78 is acting as a barricade for the Gold bulls.
The 200-period Exponential Moving Average (EMA) at $2,018.68 is straight, indicating a lackluster move ahead.
Also, the Relative Strength Index (RSI) (14) is oscillating in the 40.00-60.00, which indicates that investors await a fresh trigger for further action.
Gold hourly chart
XAU/USD
| OVERVIEW | |
|---|---|
| Today last price | 2016.81 |
| Today Daily Change | 0.35 |
| Today Daily Change % | 0.02 |
| Today daily open | 2016.46 |
| TRENDS | |
|---|---|
| Daily SMA20 | 2008.72 |
| Daily SMA50 | 1975.65 |
| Daily SMA100 | 1922.14 |
| Daily SMA200 | 1822.15 |
| LEVELS | |
|---|---|
| Previous Daily High | 2022.18 |
| Previous Daily Low | 2007.36 |
| Previous Weekly High | 2048.27 |
| Previous Weekly Low | 2000.95 |
| Previous Monthly High | 2048.75 |
| Previous Monthly Low | 1949.83 |
| Daily Fibonacci 38.2% | 2016.52 |
| Daily Fibonacci 61.8% | 2013.02 |
| Daily Pivot Point S1 | 2008.49 |
| Daily Pivot Point S2 | 2000.51 |
| Daily Pivot Point S3 | 1993.67 |
| Daily Pivot Point R1 | 2023.31 |
| Daily Pivot Point R2 | 2030.15 |
| Daily Pivot Point R3 | 2038.13 |