Gold, Chart of the Week: XAU/USD bears lurking in a coiled market, low hanging fruit for initial balance eyed
2 min read
- Gold price coiled in a tight spot ahead of the open following a FRD on Friday.
- Gold price bears eye a breakout to the downside into LHF to target a 61.8% ratio.
In last week’s pre-open analysis, Gold, Chart of the Week: XAU/USD bulls creep on to the backside of daily bearish trend, we discussed the prospects of a move up, a short squeeze if we saw a break of $1,925 to target the 4-hour and daily imbalances towards $1,983 resistance.
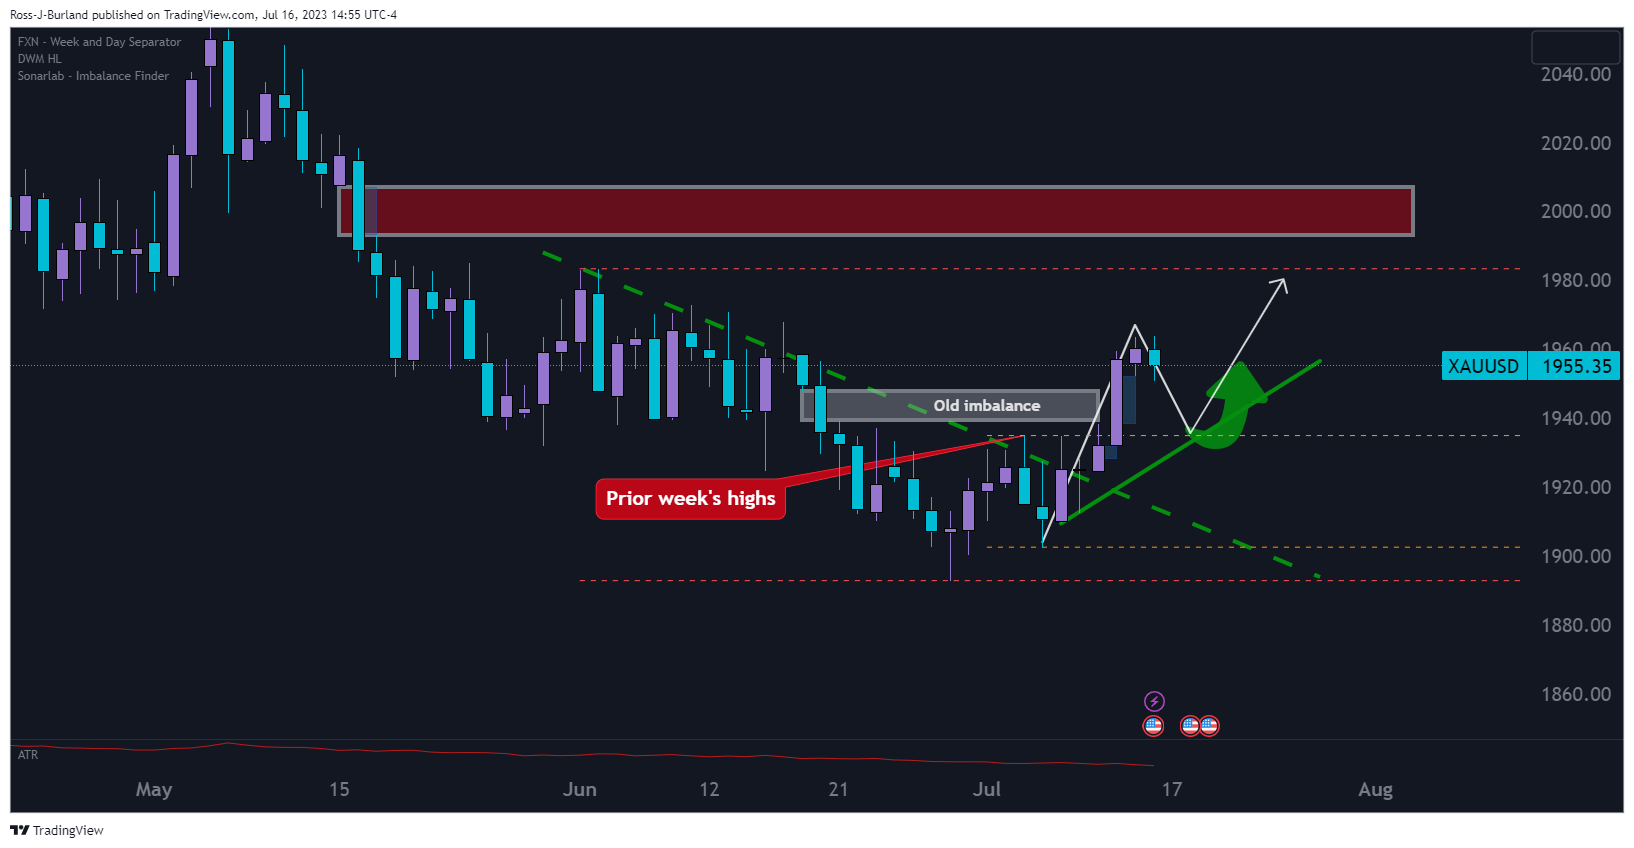
In ongoing analysis, Gold Price Forecast: XAU/USD bears eye a move to a 61.8% Fibo, but bulls test key resistance, the price was tracked into through the $1,940s imbalance area as the bulls broke the prior week’s highs:
Gold price prior analysis,daily chart
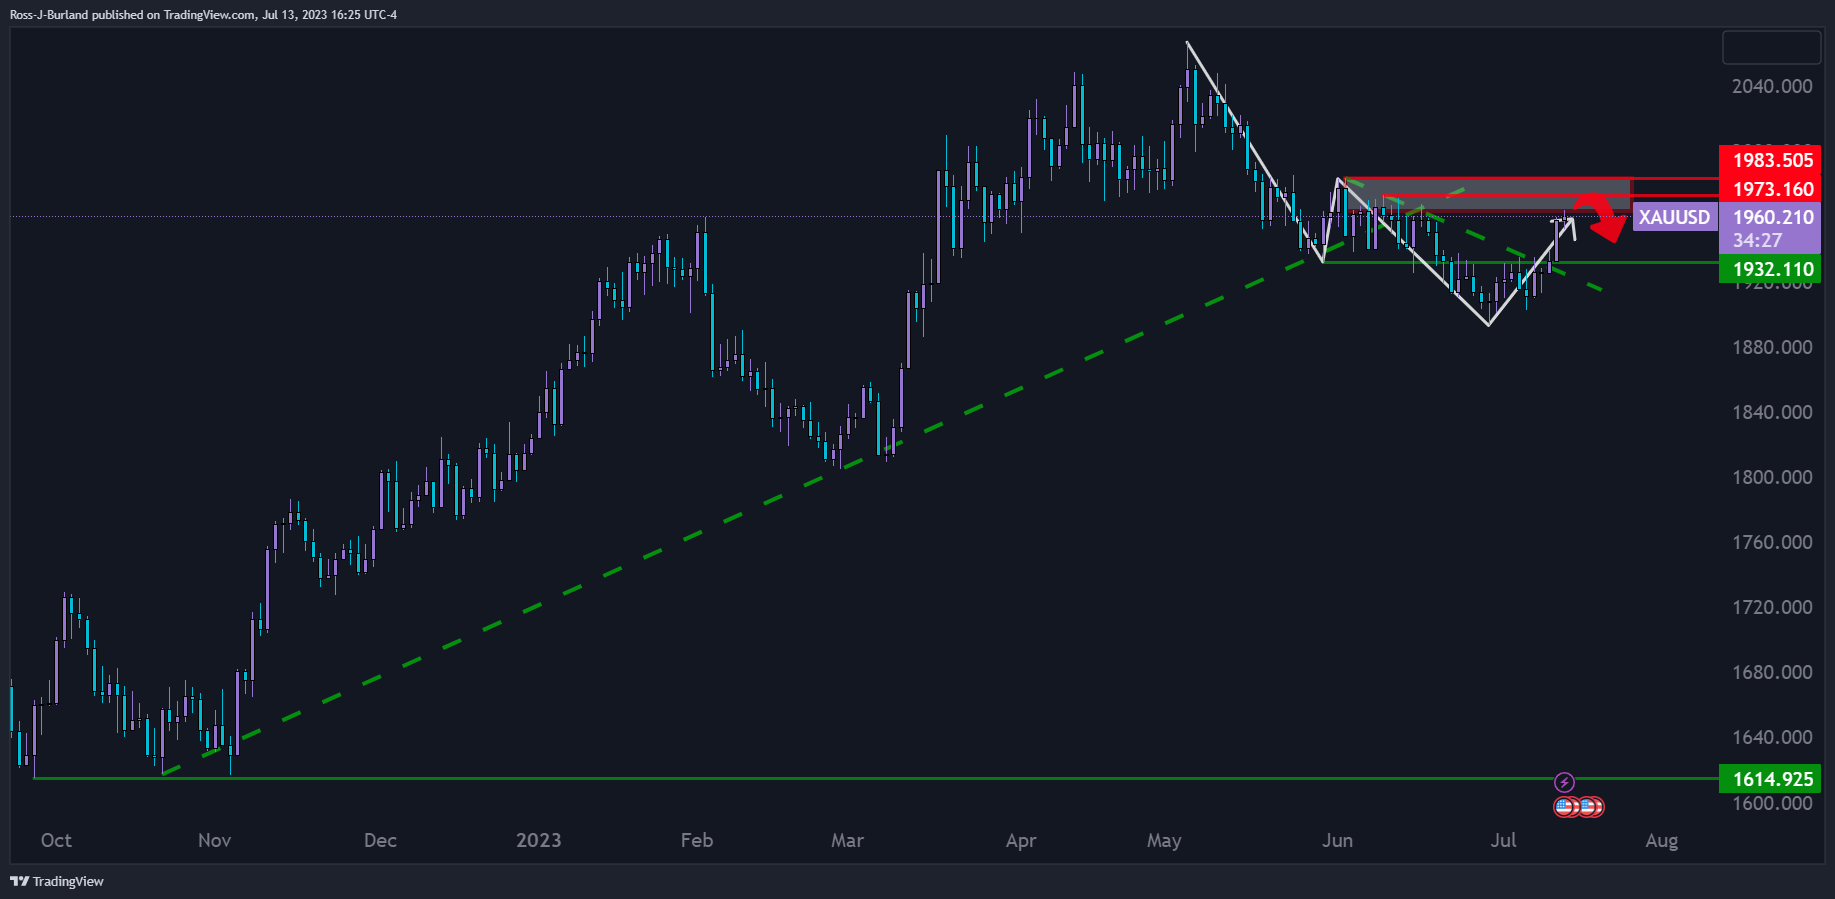
The daily charts showed that the price was now in a resistance area and could be on the verge of a correction. The 61.8% Fibonacci retracement area is eyed as support to $1,932.
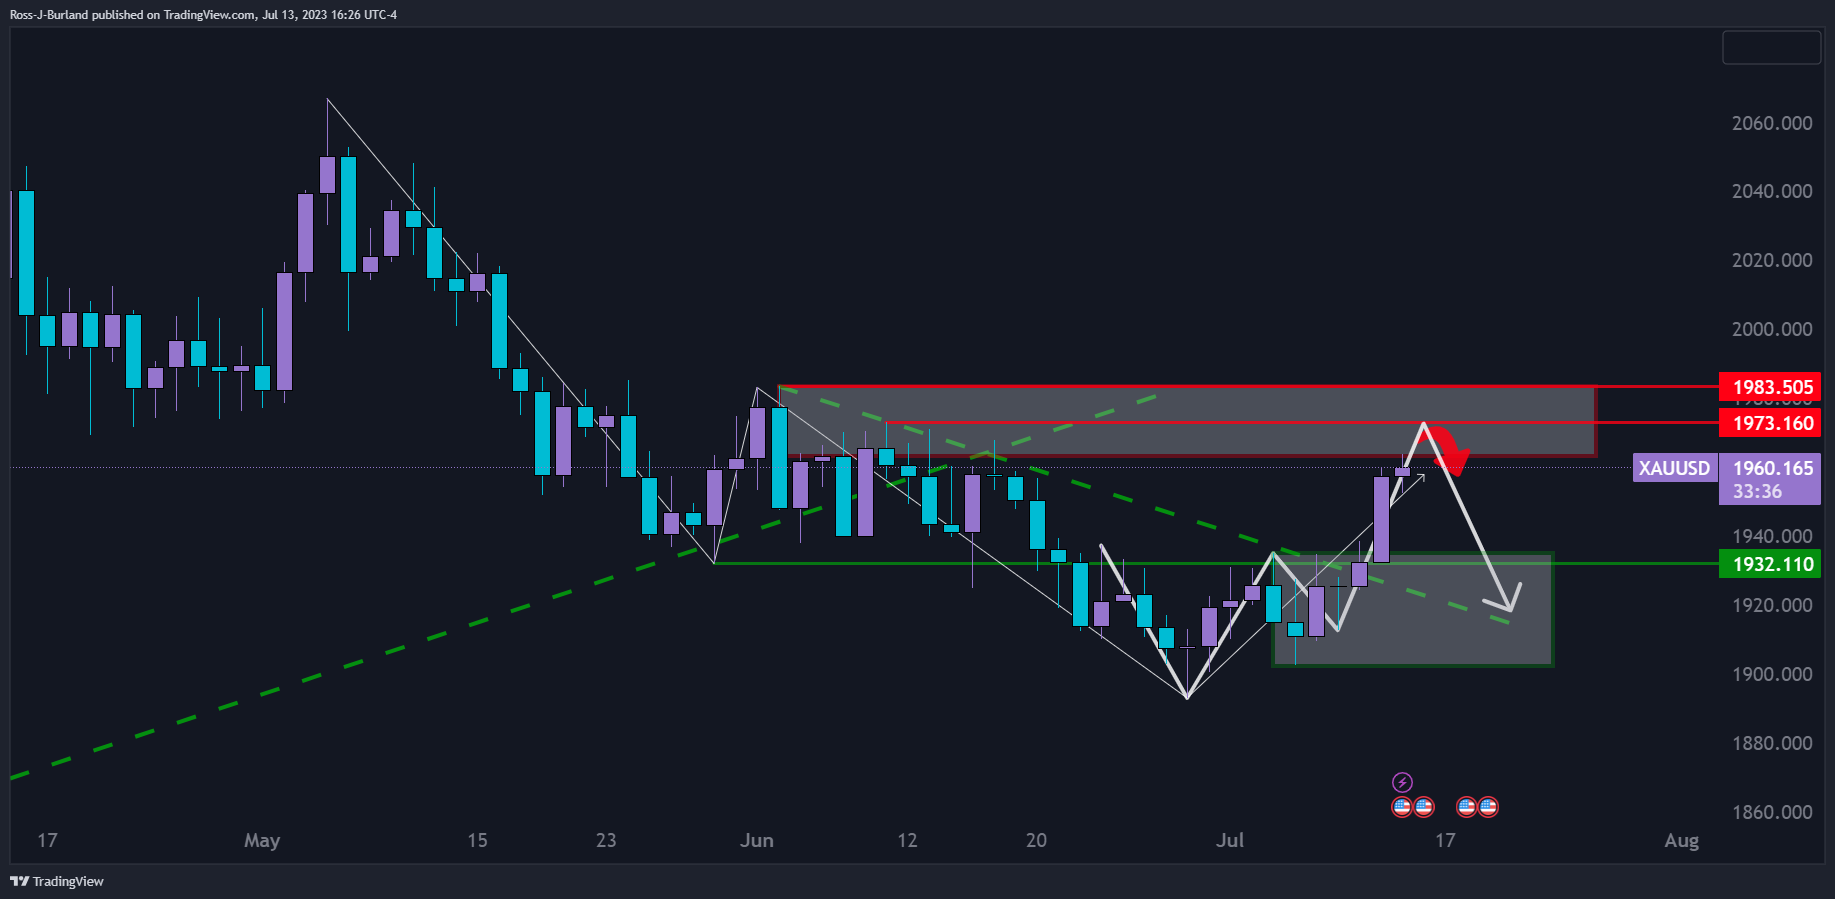
Gold price update
Last week’s high could be the first downside target as previously explained before the next significant move higher with last month’s highs eyed to the upside in a short squeeze continuation.
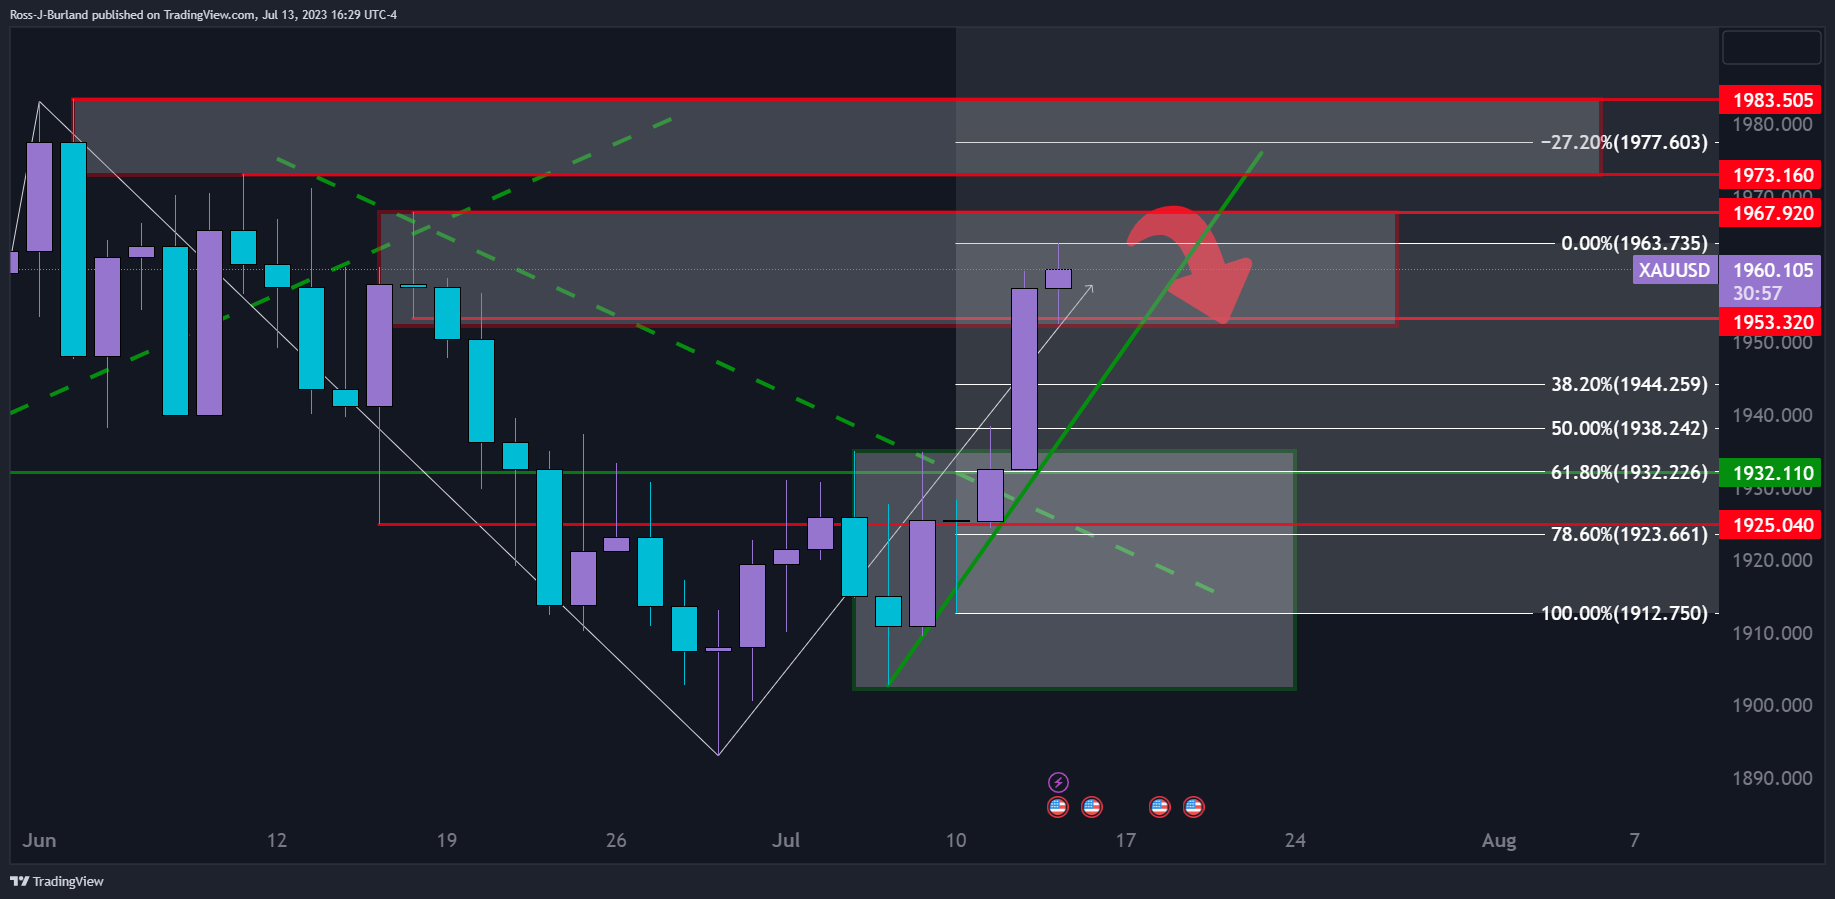
Gold price hourly charts
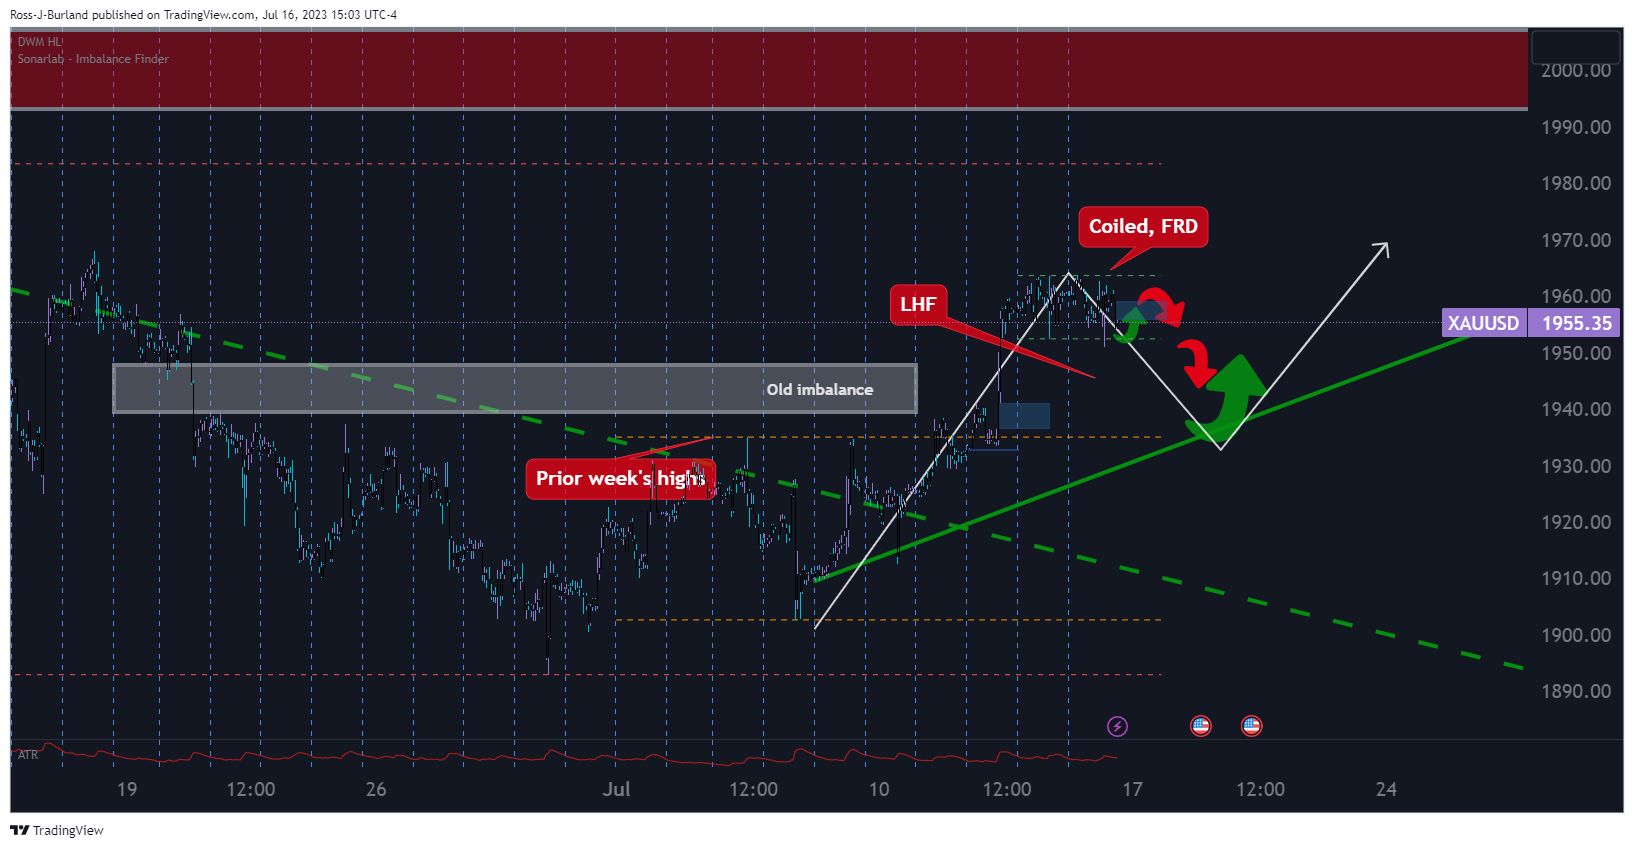
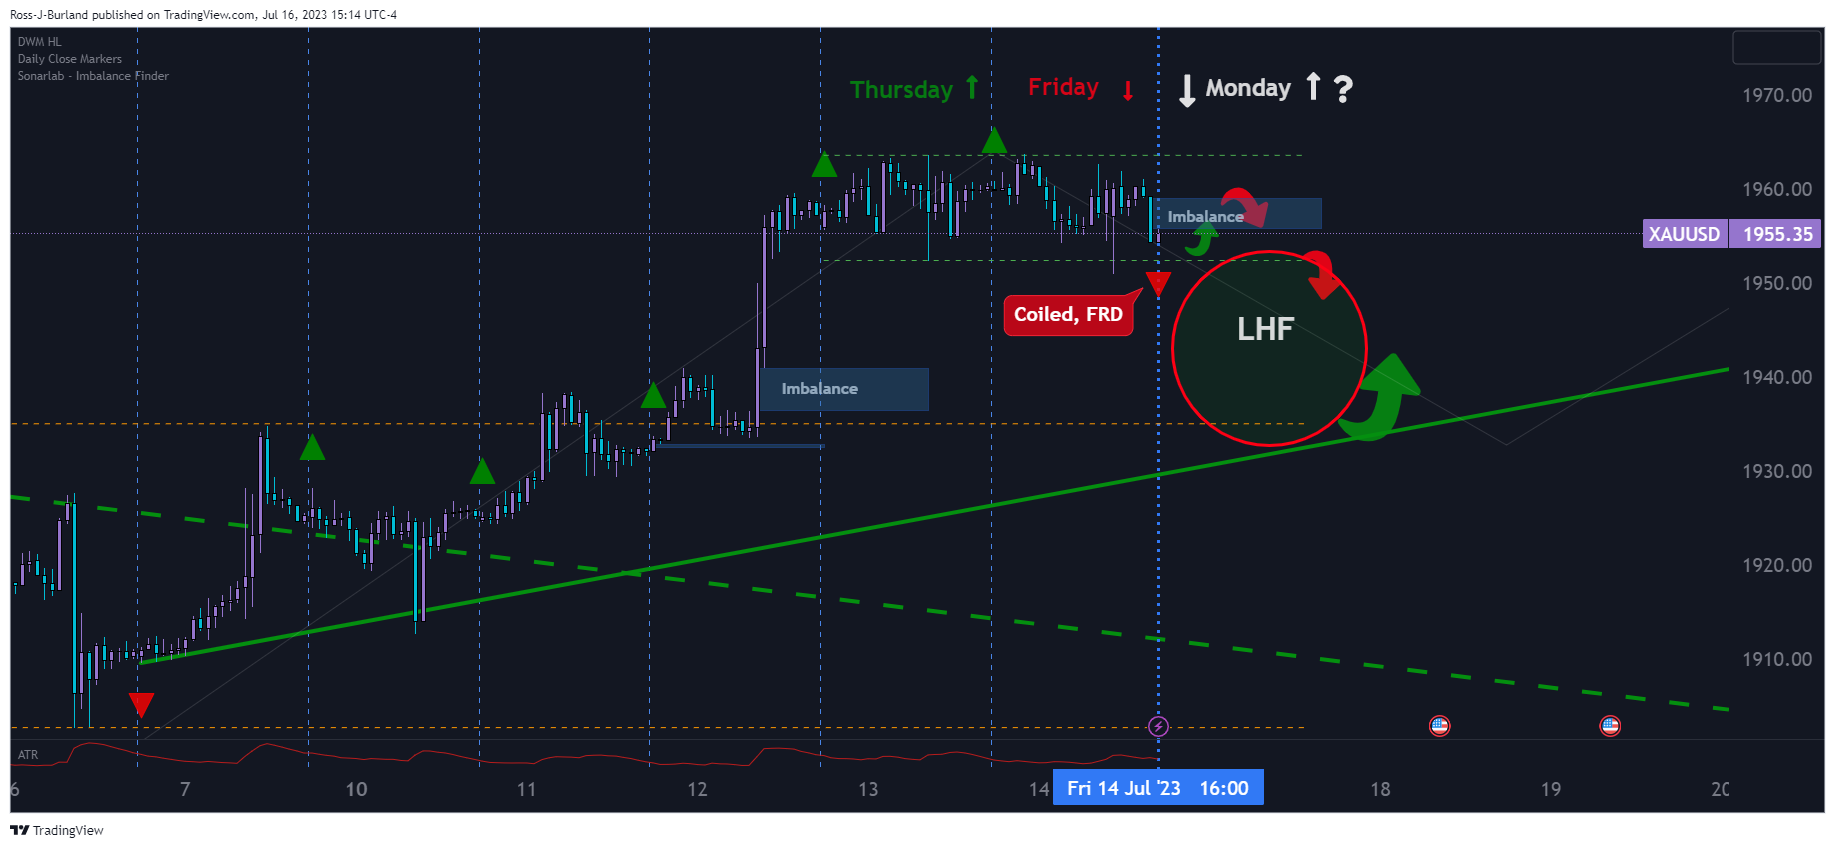
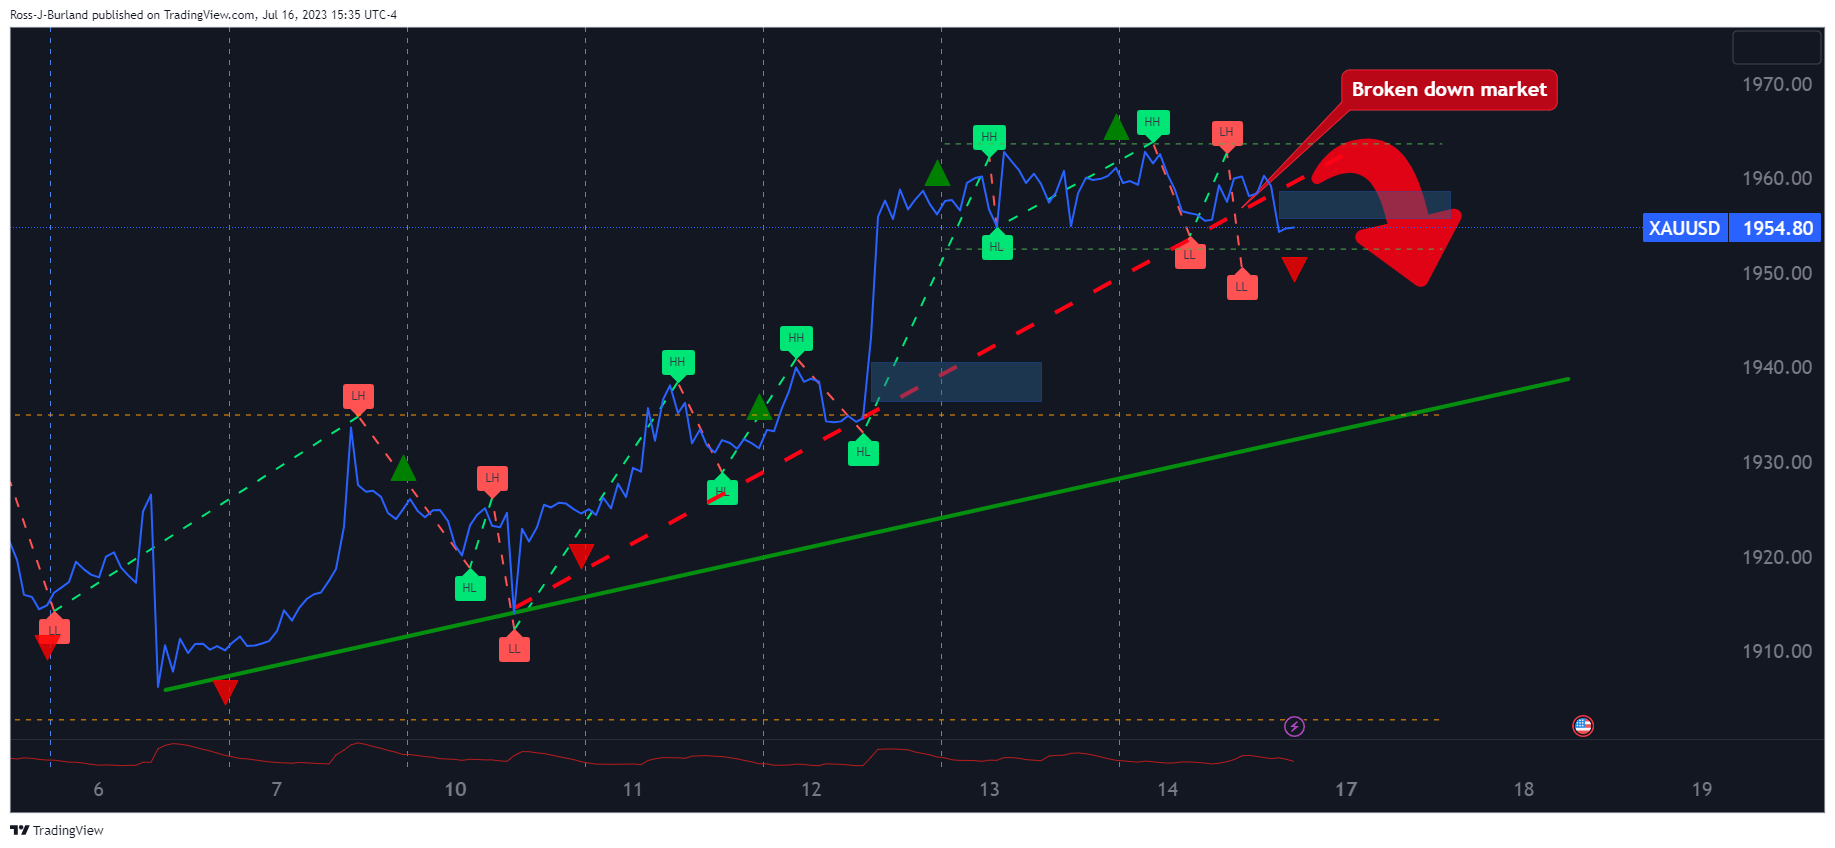
The market is coiled between Thursday’s highs and lows and a breakout is on the cards. We have an imbalance of price to the upside, which might see the Gold price rally before the thesis’s downside can play out.
We can see that Friday closed as a First Red Day, FRD, within a series of higher closes since Friday, July 7. This leaves the downside’s Low Hanging Fruit, LHF, vulnerable for the opening and the week’s initial balance.