Gold Price Forecast: XAU/USD appears well-set to break $1,900, US NFP eyed
4 min read
- Gold Price languishes near three-month low, on the way to posting fourth consecutive weekly loss.
- Mostly upbeat United States data, challenges to sentiment underpin US Dollar strength and weigh on XAU/USD.
- Fresh fears from China markets, Sino-American tussles join recession woes to constitute risk-off mood.
- Hawkish Federal Reserve bets also keep Gold bears hopeful as markets braces for US Nonfarm Payrolls.
Gold Price (XAU/USD) remains on the bear’s radar despite the latest corrective bounce off the weekly low, licking its wounds near $1,911 amid early Friday morning in Asia. In doing so, the XAU/USD justifies risk aversion, as well as upbeat United States data, to underpin the bullish bias about the Gold Price. Adding strength to the Gold Price downside are the fears surrounding China.
Gold Price eyes further downside amid sour sentiment, hawkish Fed concerns
Gold Price lures sellers as mostly upbeat United States jobs data underpin hawkish Federal Reserve (Fed) bets while China-linked headlines aren’t impressive. Additionally, the US-China tension and positioning before Friday’s US employment report also weigh on the sentiment and the XAU/USD price.
That said, China witnesses a heavy outflow of funds amid fresh fears emanating from the housing giants, including government-backed organizations. Adding strength to the downbeat mood could be the recently softer activity data from Beijing and the US-China trade war, not to forget the cautious mood as US Treasury Secretary Janet Yellen is in the dragon nation.
Elsewhere, US ADP Employment Change marked the largest one-month increase since February 2022, to 497K for June versus 228K expected and 267K prior (revised). That said, the ISM Services PMI also improved to 53.9 for the said month from 50.3 in May, versus the market expectation of 51.0. Further, the Challenges Job Cuts also slumps to 40.709K from 80.089K previous readings. However, the JOLTS Job Openings drops to 9.8M from 10.103M, compared to analysts’ estimation of 9.93M. It should be noted that the Initial Jobless Claims also rises to 248K for the week ended on June 30, versus 245K expected and 236K previous readings (revised).
It should be noted that market players expect the Fed to increase interest rates in its next policy meeting on July 26. The probability of a 25-basis-points rate hike is at 91.8%, according to data from the CME Group FedWatch tool, up slightly from 90.5% a day earlier.
Against this backdrop, Wall Street benchmarks dropped while the US Treasury bond yields refreshed a multi-day high.
Alternatively, the World Gold Council (WGC) expects that gold will continue to be supported by rangebound bond yields and a lower dollar. “If economic conditions worsen, gold investment demand should increase. In contrast, a soft landing or significantly stricter monetary policy can lead to disinvestment,” adds WGC.
Moving on, Gold traders may witness consolidation in prices ahead of the top-tier US employment data for June. Among them, the headline Nonfarm Payrolls (NFP), expected to ease to 225K from 339K, will gain major attention considering the previous day’s upbeat signals from ADP Employment Change. Should the jobs report arrive as positive, the XAU/USD can have a further downside to witness.
Gold Price Technical Analysis
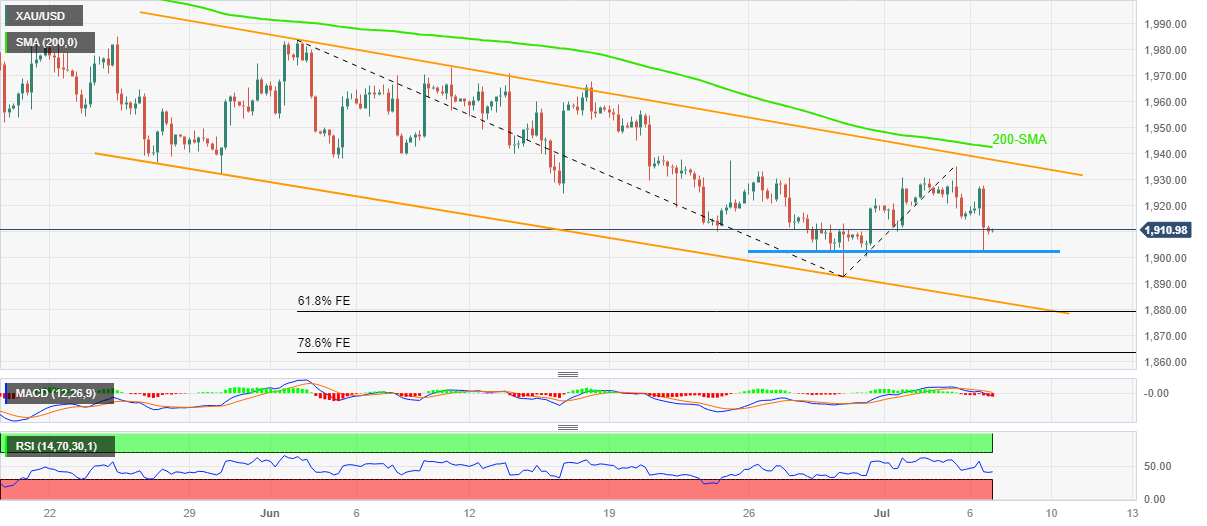
Although one-week-old horizontal support restricts the immediate downside of the Gold Price around the $1,900 round figure, a six-week-old bearish channel and the XAU/USD’s sustained trading below the 200-SMA keep the metal sellers hopeful.
Adding strength to the downside bias are the bearish signals from the Moving Average Convergence and Divergence (MACD) indicator and the downbeat Relative Strength Index (RSI) line, placed at 14.
It’s worth noting, however, that the RSI conditions are weak and hence suggest bottom-picking of the Gold price, which in turn highlights the support line of the stated descending trend channel, around $1,880 by the press time, as the short-term key support.
Following that, the 61.8% Fibonacci Expansion (FE) of the XAU/USD moves from June 02 to July 05, close to $1,879, as well as the 78.6% FE level of near $1,863, can act as extra filters towards the south.
Meanwhile, the Gold Price recovery remains elusive unless it stays below the aforementioned bearish channel’s top line, around $1,938 at the latest.
Even if the XAU/USD manages to defy the bearish chart formation by crossing the $1,938 hurdle, the 200-SMA level of around $1,943 can challenge the Gold buyers before giving them control.
Gold Price: Four-hour chart
Trend: Bearish
ADDITIONAL IMPORTANT LEVELS
| OVERVIEW | |
|---|---|
| Today last price | 1911.07 |
| Today Daily Change | -4.34 |
| Today Daily Change % | -0.23% |
| Today daily open | 1915.41 |
| TRENDS | |
|---|---|
| Daily SMA20 | 1933.75 |
| Daily SMA50 | 1964.83 |
| Daily SMA100 | 1946.38 |
| Daily SMA200 | 1863.76 |
| LEVELS | |
|---|---|
| Previous Daily High | 1935.09 |
| Previous Daily Low | 1914.84 |
| Previous Weekly High | 1933.39 |
| Previous Weekly Low | 1893.01 |
| Previous Monthly High | 1983.5 |
| Previous Monthly Low | 1893.01 |
| Daily Fibonacci 38.2% | 1922.58 |
| Daily Fibonacci 61.8% | 1927.35 |
| Daily Pivot Point S1 | 1908.47 |
| Daily Pivot Point S2 | 1901.53 |
| Daily Pivot Point S3 | 1888.22 |
| Daily Pivot Point R1 | 1928.72 |
| Daily Pivot Point R2 | 1942.03 |
| Daily Pivot Point R3 | 1948.97 |