Gold Price Forecast: XAU/USD loses momentum above the $1,960 area, Bear Cross eyed
2 min read
- Gold price remains pressured and holds above the $1,960 level on Monday.
- The Initial support level is located at $1,940; the immediate resistance level is seen at $1,965.
- The 50-hour EMA is on the verge of crossing below the 100-hour EMA.
Gold price struggles to gain traction during the Asian session on Monday. The XAU/USD currently trades just below the $1,960 level, down 0.11% for the day. Market players await the Federal Open Market Committee (FOMC) meeting and Fed Chairman Jerome Powell’s press conference. These events could significantly impact the USD-denominated gold price.
The Federal Reserve (Fed) will announce the outcome of its monetary policy meeting on Wednesday, and market participants expect the Fed to raise interest rates by 25 basis points (bps). The possibility of another Fed rate hike after the July meeting increased to 28% from 15.9% last month, according to the CME FedWatch Tool. That said, the prospects of additional Fed and ECB policy tightening might be another factor capping the upside for the non-yielding gold price.
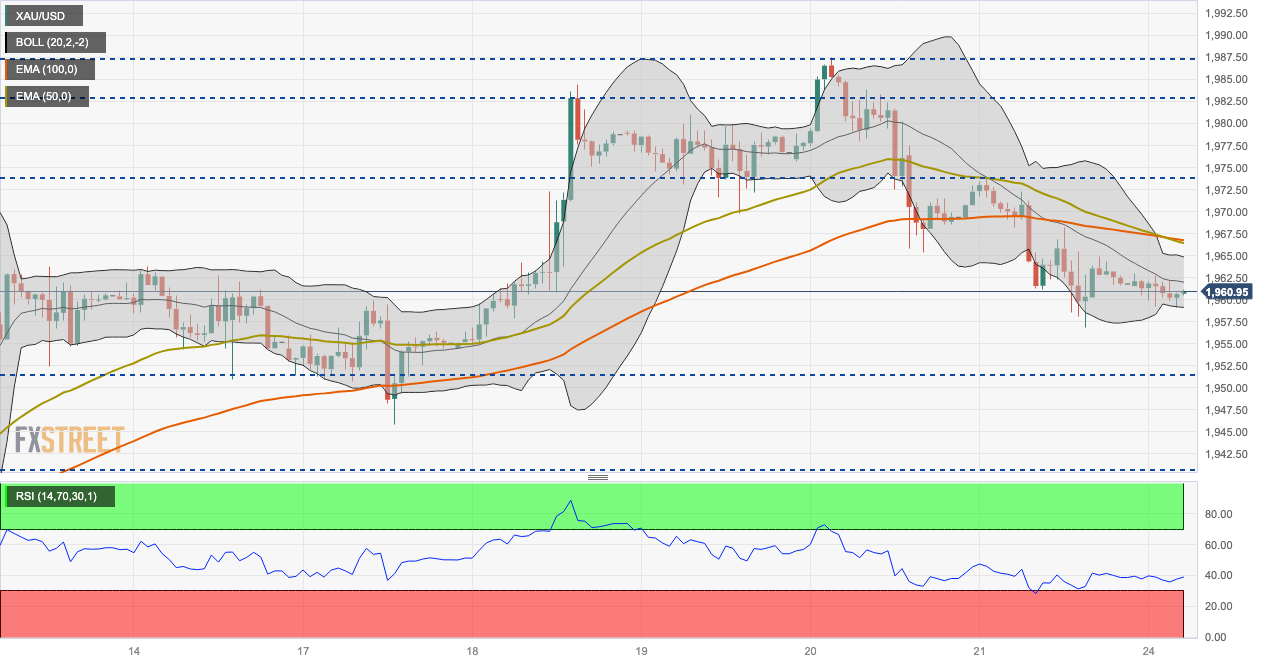
Looking at the one-hour chart, a break below the lower limit of the Bollinger Band at $1,950 will see a drop towards $1,940 (High of July 12) en route to $1,930 and $1,920 (High of July 3). In case the selling pressure remains, the pair would see the critical contention at $1,900, a psychological round mark.
On the upside, the immediate resistance level is seen at $1,965, representing the upper boundary of the Bollinger Band. A decisive break above the latter would drive gold towards $1,972 (High of July 21), followed by $1,983 (High of July 18). The additional upside filter is $2,000.
It’s worth noting that the 50-hour Exponential Moving Average (EMA) is on the verge of crossing below the 100-hour EMA. If a decisive crossover occurs on the one-hour chart, It would validate a Bear Cross, highlighting that the path of least resistance for gold is to the downside.
Gold price one-hour chart
XAU/USD
| OVERVIEW | |
|---|---|
| Today last price | 1960.66 |
| Today Daily Change | -1.18 |
| Today Daily Change % | -0.06 |
| Today daily open | 1961.84 |
| TRENDS | |
|---|---|
| Daily SMA20 | 1937.15 |
| Daily SMA50 | 1949.11 |
| Daily SMA100 | 1960.77 |
| Daily SMA200 | 1879.77 |
| LEVELS | |
|---|---|
| Previous Daily High | 1973.84 |
| Previous Daily Low | 1956.88 |
| Previous Weekly High | 1987.54 |
| Previous Weekly Low | 1945.85 |
| Previous Monthly High | 1983.5 |
| Previous Monthly Low | 1893.01 |
| Daily Fibonacci 38.2% | 1963.36 |
| Daily Fibonacci 61.8% | 1967.36 |
| Daily Pivot Point S1 | 1954.53 |
| Daily Pivot Point S2 | 1947.23 |
| Daily Pivot Point S3 | 1937.57 |
| Daily Pivot Point R1 | 1971.49 |
| Daily Pivot Point R2 | 1981.15 |
| Daily Pivot Point R3 | 1988.45 |