Gold Price Forecast: XAU/USD eyes first weekly loss in four near $1,950 as Fed inflation looms
4 min read
- Gold Price licks its wounds after falling the most in eight weeks amid firmer US Dollar.
- US Dollar bulls cheer upbeat prints of United States Q2 GDP Annualized, dovish ECB hike.
- Firmer US Core PCE Price Index can weigh on XAU/USD as Fed showed readiness for September rate hike if needed.
Gold Price (XAU/USD) steadies around the mid-$1,900s amid the early hours of Friday’s Asian session, after posting the biggest daily slump in two months the previous day. In doing so, the XAU/USD portrays the market’s consolidation ahead of the top-tier US data following a whippy day that initially propelled the Gold Price towards the weekly top on the softer US Dollar and risk-on mood before drowning it on the strong United States data and firmer Treasury bond yields.
Gold Price drops as US Dollar rises on firmer United States data, ECB moves
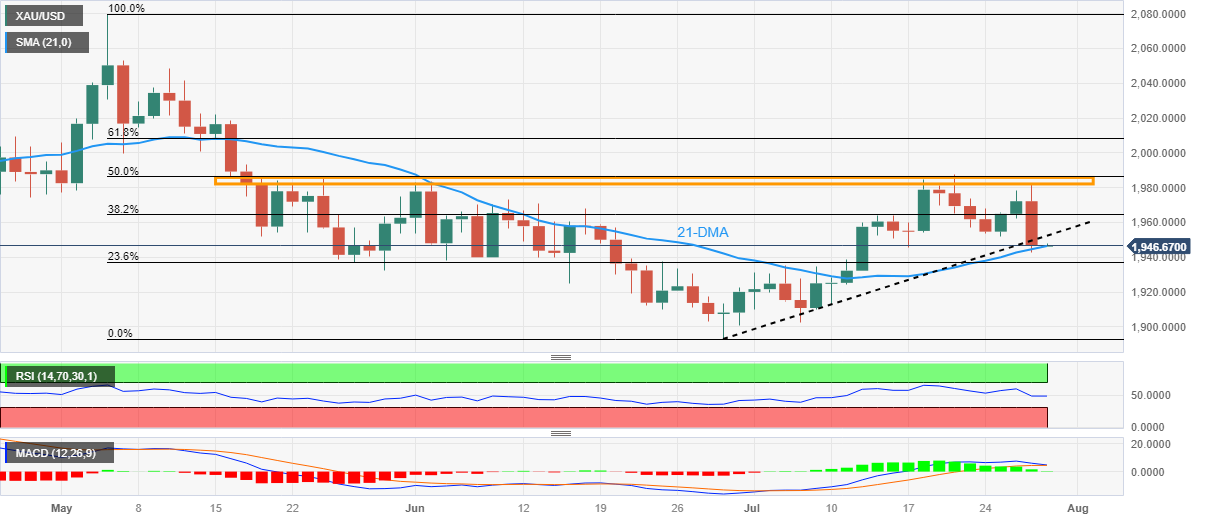
Gold Price aptly justified the word “turnaround Thursday” as it initially rose to the highest levels in a week while poking a 2.5-month-old horizontal resistance before breaking a multi-day-old support line. It’s worth noting that the XAU/USD remains defensive around the 21-DMA level near $1,945 by the press time.
That said, the market’s easing fears of the Federal Reserve’s (Fed) rate hike and upbeat China Industrial Profits, as well as hopes of more stimulus from Beijing, fuelled the Gold Price to refresh the weekly top. However, strong prints of the United States data and upbeat yields drowned the XAU/USD afterward. On the same line could be the dovish hike of the European Central Bank (ECB) and the cautious mood ahead of the Fed’s preferred inflation data.
On Thursday, the preliminary readings of the US Gross Domestic Product (GDP) Annualized for the second quarter (Q2) improved to 2.4% from 2.0% prior, versus 1.8% market forecast. On the same line, the US Durable Goods Orders also jumps 4.7% for June compared to 1.0% expected and 1.8% expected (revised). Additionally, Initial Jobless Claims declines to 221K for the week ended on July 21 versus 235K prior and analysts’ estimations of 228K. It should be observed that the US Pending Home Sales for June also improved to 0.3% MoM versus -0.5% expected and -2.5% prior (revised).
However, the first estimations of the US Q2 Core Personal Consumption Expenditure eases to 3.8% QoQ from 4.9% prior and 4.0% market forecasts whereas GDP Price Index edges lower to 2.6% from 4.1% previous readings and 3.0% expected.
That said, the European Central Bank (ECB) matches market forecasts by announcing 25 basis points (bps) increase in the benchmark rates. That said, the policy statement showed the board is “open-minded” about further tightening. However, the statement dumped reference to the need to bring the rates to a level that cuts inflation quickly enough and gained the attention of the Euro bears, especially when backed by ECB President Christine Lagarde’s comments stating, “The wording change in the statement was not random or irrelevant.” On the same line, ECB’s Lagarde also signaled the nearness to the end of the inflation battle by suggesting smaller grounds to cover while also showing data-dependency of the next rate decision as well. It’s worth noting that the Euro’s slump strengthens the US Dollar and weighs on the Gold Price.
Amid these plays, US Dollar Index (DXY) posted the biggest daily jump since March 15 the previous day, not to forget mentioning a stellar rebound from the weekly low, as the US statistics recall the Fed hawks and bolstered the Treasury bond yields. It’s worth noting that the Wall Street benchmarks closed with nearly half a percent of daily losses whereas the benchmark US 10-year Treasury bond yields marked the biggest daily jump in a month to refresh a three-week high near 4.02%, close to 4.0% by the press time.
Looking ahead, the risk catalysts may entertain the Gold traders ahead of the Fed’s favorite inflation gauge, namely the Core Personal Consumption Expenditure (PCE) Price Index for June, expected 4.2% YoY versus 4.6% prior, will be crucial to watch for clear directions.
Gold Price Technical Analysis
Gold Price justifies multiple failures to cross the 10-week-old horizontal resistance, as well as the downside break of an upward-sloping support line from late June, while welcoming the bears after their three-week vacation.
Also favoring the XAU/USD sellers is the looming bear cross on the Moving Average Convergence and Divergence (MACD) indicator, as well as the Relative Strength Index (RSI) line’s pullback.
It’s worth noting, however, that a sustained downside break of the 21-DMA support surrounding $1,945 becomes necessary for the Gold bears to keep the reins. Even so, a slew of peaks and troughs marked since mid-June around $1,930-25 can test the XAU/USD sellers before directing them to the yearly low registered the last month around $1,893.
On the flip side, a daily closing beyond the support-turned-resistance line of around $1,955 may allow the Gold Price to pare weekly loss, if backed by the aforementioned United States inflation clues.
However, the 38.2% Fibonacci retracement level of the metal’s May-June downside and the previously stated 2.5-month-old horizontal resistance, respectively near $1,965 and $1,985, will challenge the Gold buyers before giving them control.
Overall, the Gold Price is likely to witness further downside but the road towards the south is long and bumpy.
Gold Price: Daily chart
Trend: Further downside expected
ADDITIONAL IMPORTANT LEVELS
| OVERVIEW | |
|---|---|
| Today last price | 1946.53 |
| Today Daily Change | -25.64 |
| Today Daily Change % | -1.30% |
| Today daily open | 1972.17 |
| TRENDS | |
|---|---|
| Daily SMA20 | 1944.52 |
| Daily SMA50 | 1947.2 |
| Daily SMA100 | 1964.53 |
| Daily SMA200 | 1884.5 |
| LEVELS | |
|---|---|
| Previous Daily High | 1978.39 |
| Previous Daily Low | 1962.06 |
| Previous Weekly High | 1987.54 |
| Previous Weekly Low | 1945.85 |
| Previous Monthly High | 1983.5 |
| Previous Monthly Low | 1893.01 |
| Daily Fibonacci 38.2% | 1972.15 |
| Daily Fibonacci 61.8% | 1968.3 |
| Daily Pivot Point S1 | 1963.36 |
| Daily Pivot Point S2 | 1954.54 |
| Daily Pivot Point S3 | 1947.03 |
| Daily Pivot Point R1 | 1979.69 |
| Daily Pivot Point R2 | 1987.2 |
| Daily Pivot Point R3 | 1996.02 |