Gold Price Forecast: XAU/USD bears eye $1,870 on firmer US Dollar, yields – Confluence Detector
3 min read
- Gold Price stabilizes at the lowest level in five months.
- Hawkish Federal Reserve bias, China woes join mostly upbeat US data to propel US Dollar and yields.
- Risk catalysts, bond market moves eyed as global economic fears tease XAU/USD bears.
Gold Price (XAU/USD) drops to a fresh low in five months before consolidating around $1,890 as market players seek more clues to extend the previous downturn, backed by the hawkish Federal Reserve (Fed) concerns and the risk-off mood. That said, fears of economic slowdown in China and softer growth numbers in developed economies join firmer US data to propel the US Treasury bond yields and the US Dollar, which in turn weigh on the XAU/USD. It’s worth noting that the US 10-year Treasury bond yields rise to the highest level since October 2022, around 4.29% at the latest. It should be noted that such a high level of bond coupons triggered fears of economic slowdown and drowned the riskier assets, while also underpinning the US Dollar, during late 2022. Apart from the yields, downbeat economic projections from Fitch Ratings also exert downside pressure on the sentiment and Gold Price.
Moving on, an absence of major data/events may allow the Gold Price to consolidate recent losses at the multi-day low. However, the risk aversion wave and firmer yields can keep the US Dollar on the front foot, which in turn will prod the XAU/USD rebound unless witnessing any strong positive data/news that can weigh on the Greenback and improve the mood.
Gold Price: Key levels to watch
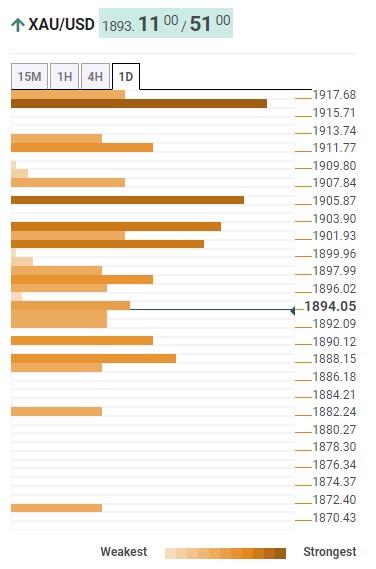
As per our Technical Confluence, the Gold Price stays well beneath the $1,917-18 resistance confluence, comprising the Fibonacci 161.8% on one-day, 200-HMA and Pivot Point one-month S1.
Also keeping the XAU/USD bears hopeful is the metal’s sustained trading below the $1,905 support, now resistance, encompassing the convergence of the 200-DMA and 50-DMA, as well as the middle band of the Bollinger on the four-hour (4H) play.
It’s worth noting, however, that the $1,888 level including the lower band of the Bollinger on the hourly play and the Pivot Point one-week S2 restricts the immediate downside of the Gold Price.
Following that, there prevails a smooth run for the XAU/USD bears unless hitting the $1,870 support including Pivot Point one-day S3. During the fall, the Pivot point one-day S2 may prod the Gold sellers around $1,882.
Should the Gold bears remain dominant past $1,870, the odds of witnessing a slump toward an early March swing high of around $1,858 can’t be ruled out.
Here is how it looks on the tool
About Technical Confluences Detector
The TCD (Technical Confluences Detector) is a tool to locate and point out those price levels where there is a congestion of indicators, moving averages, Fibonacci levels, Pivot Points, etc. If you are a short-term trader, you will find entry points for counter-trend strategies and hunt a few points at a time. If you are a medium-to-long-term trader, this tool will allow you to know in advance the price levels where a medium-to-long-term trend may stop and rest, where to unwind positions, or where to increase your position size.