Gold Price Forecast: XAU/USD inches back closer to $1,920, lacks bullish conviction
3 min read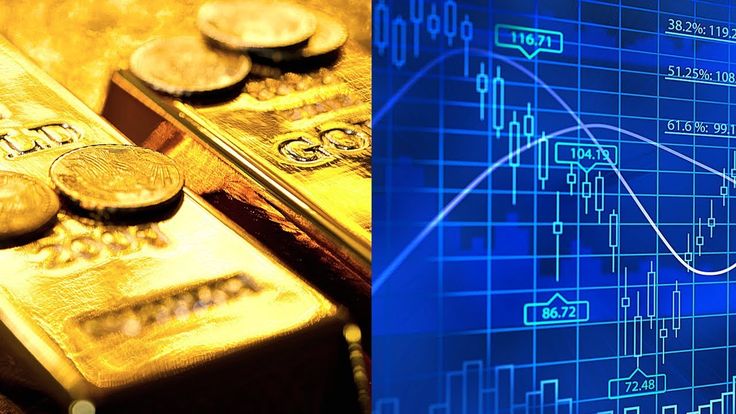
- Gold price regains some positive traction on Thursday and recovers a part of the overnight losses.
- A generally weaker risk tone benefits the safe-haven XAU/USD, though the upside seems limited.
- Hawkish major central banks might hold back bulls from placing aggressive bets around the metal.
Gold price attracts some dip-buying during the Asian session on Thursday and reverses a part of the previous day’s retracement slide from the $1,935 region, or a nearly two-week high. The XAU/USD currently trades just below the $1,920 level, up 0.20% for the day, though any meaningful appreciating move still seems elusive.
Economic woes and worsening US-China ties lend support to Gold price
A private survey showed on Wednesday that business activity in China’s service sector grew less than expected in June and further fueled worries about a global economic downturn. Apart from this, the potential risk of a further escalation in a trade conflict between China and the US – the world’s largest economies – tempers investors’ appetite for perceived riskier assets. This is evident from a generally weaker tone around the equity markets and turning out to be a key factor lending some support to the safe-haven Gold price. That said, the prospects for further policy tightening by the Federal Reserve (Fed) might hold back traders from placing aggressive bullish bets around the non-yielding yellow metal.
Bets for more rate hikes by Federal Reserve might cap XAU/USD
The minutes from the June Federal Open Market Committee (FOMC) policy meeting released on Wednesday revealed that almost all members supported resuming rate hikes as inflation remains unacceptably high. Furthermore, some members were in Favor of raising rates rather than pausing at the June meeting, flagging a very tight labor market that threatens to push wages and inflation higher. The outlook reaffirms market bets for a 25 basis points (bps) lift-off at the upcoming FOMC meeting on July 25-26 and led to the overnight sharp rise in the US Treasury bond yields. This, along with a more hawkish stance adopted by other major central banks, might contribute to capping gains for the Gold price.
Hawkish outlooks by BoE and ECB warrant caution for bulls
The current market pricing indicates the possibility of a further 130 bps of tightening by the Bank of England (BoE) by the end of this year. Moreover, BoE Governor Andrew Bailey last week justified the decision to hike interest rates by a jumbo 50 bps on June 22 and said that rates could remain at peak levels for longer than traders currently expect. Moreover, the European Central Bank (ECB) policymakers expect to increase borrowing costs again in July and September meetings despite signs the Euro Zone economy is flagging. This makes it prudent to wait for strong follow-through buying before positioning for the resumption of the recent recovery in the Gold price from its lowest level since mid-March.
Gold price technical outlook
From a technical perspective, the $1,925-$1,926 region is likely to act as an immediate hurdle ahead of the overnight swing high, around the $1,935 area. This is followed by the 100-day Simple Moving Average (SMA), currently around the $1,947 zone. A sustained strength beyond the latter might trigger a short-covering rally and lift the Gold price to the $1,962-$1,964 area en route to the $1,970-$1,972 supply zone. Some follow-through buying should allow bulls to reclaim the $2,000 psychological mark and test the $2,010-$2,012 resistance.
On the flip side, the $1,915-$1,914 region now seems to protect the immediate downside ahead of the $1,908-$1,907 area and the $1,900 mark. The next relevant support is pegged near the $1,893-$1,892 region or the multi-month low touched last week. A convincing break below the said support levels will make the Gold price vulnerable to accelerate the downward trajectory towards the very important 200-day Simple Moving Average (SMA), currently around the $1,860 zone.
Key levels to watch
XAU/USD
| Overview | |
|---|---|
| Today last price | 1918.78 |
| Today Daily Change | 3.37 |
| Today Daily Change % | 0.18 |
| Today daily open | 1915.41 |
| Trends | |
|---|---|
| Daily SMA20 | 1933.75 |
| Daily SMA50 | 1964.83 |
| Daily SMA100 | 1946.38 |
| Daily SMA200 | 1863.76 |
| Levels | |
|---|---|
| Previous Daily High | 1935.09 |
| Previous Daily Low | 1914.84 |
| Previous Weekly High | 1933.39 |
| Previous Weekly Low | 1893.01 |
| Previous Monthly High | 1983.5 |
| Previous Monthly Low | 1893.01 |
| Daily Fibonacci 38.2% | 1922.58 |
| Daily Fibonacci 61.8% | 1927.35 |
| Daily Pivot Point S1 | 1908.47 |
| Daily Pivot Point S2 | 1901.53 |
| Daily Pivot Point S3 | 1888.22 |
| Daily Pivot Point R1 | 1928.72 |
| Daily Pivot Point R2 | 1942.03 |
| Daily Pivot Point R3 | 1948.97 |