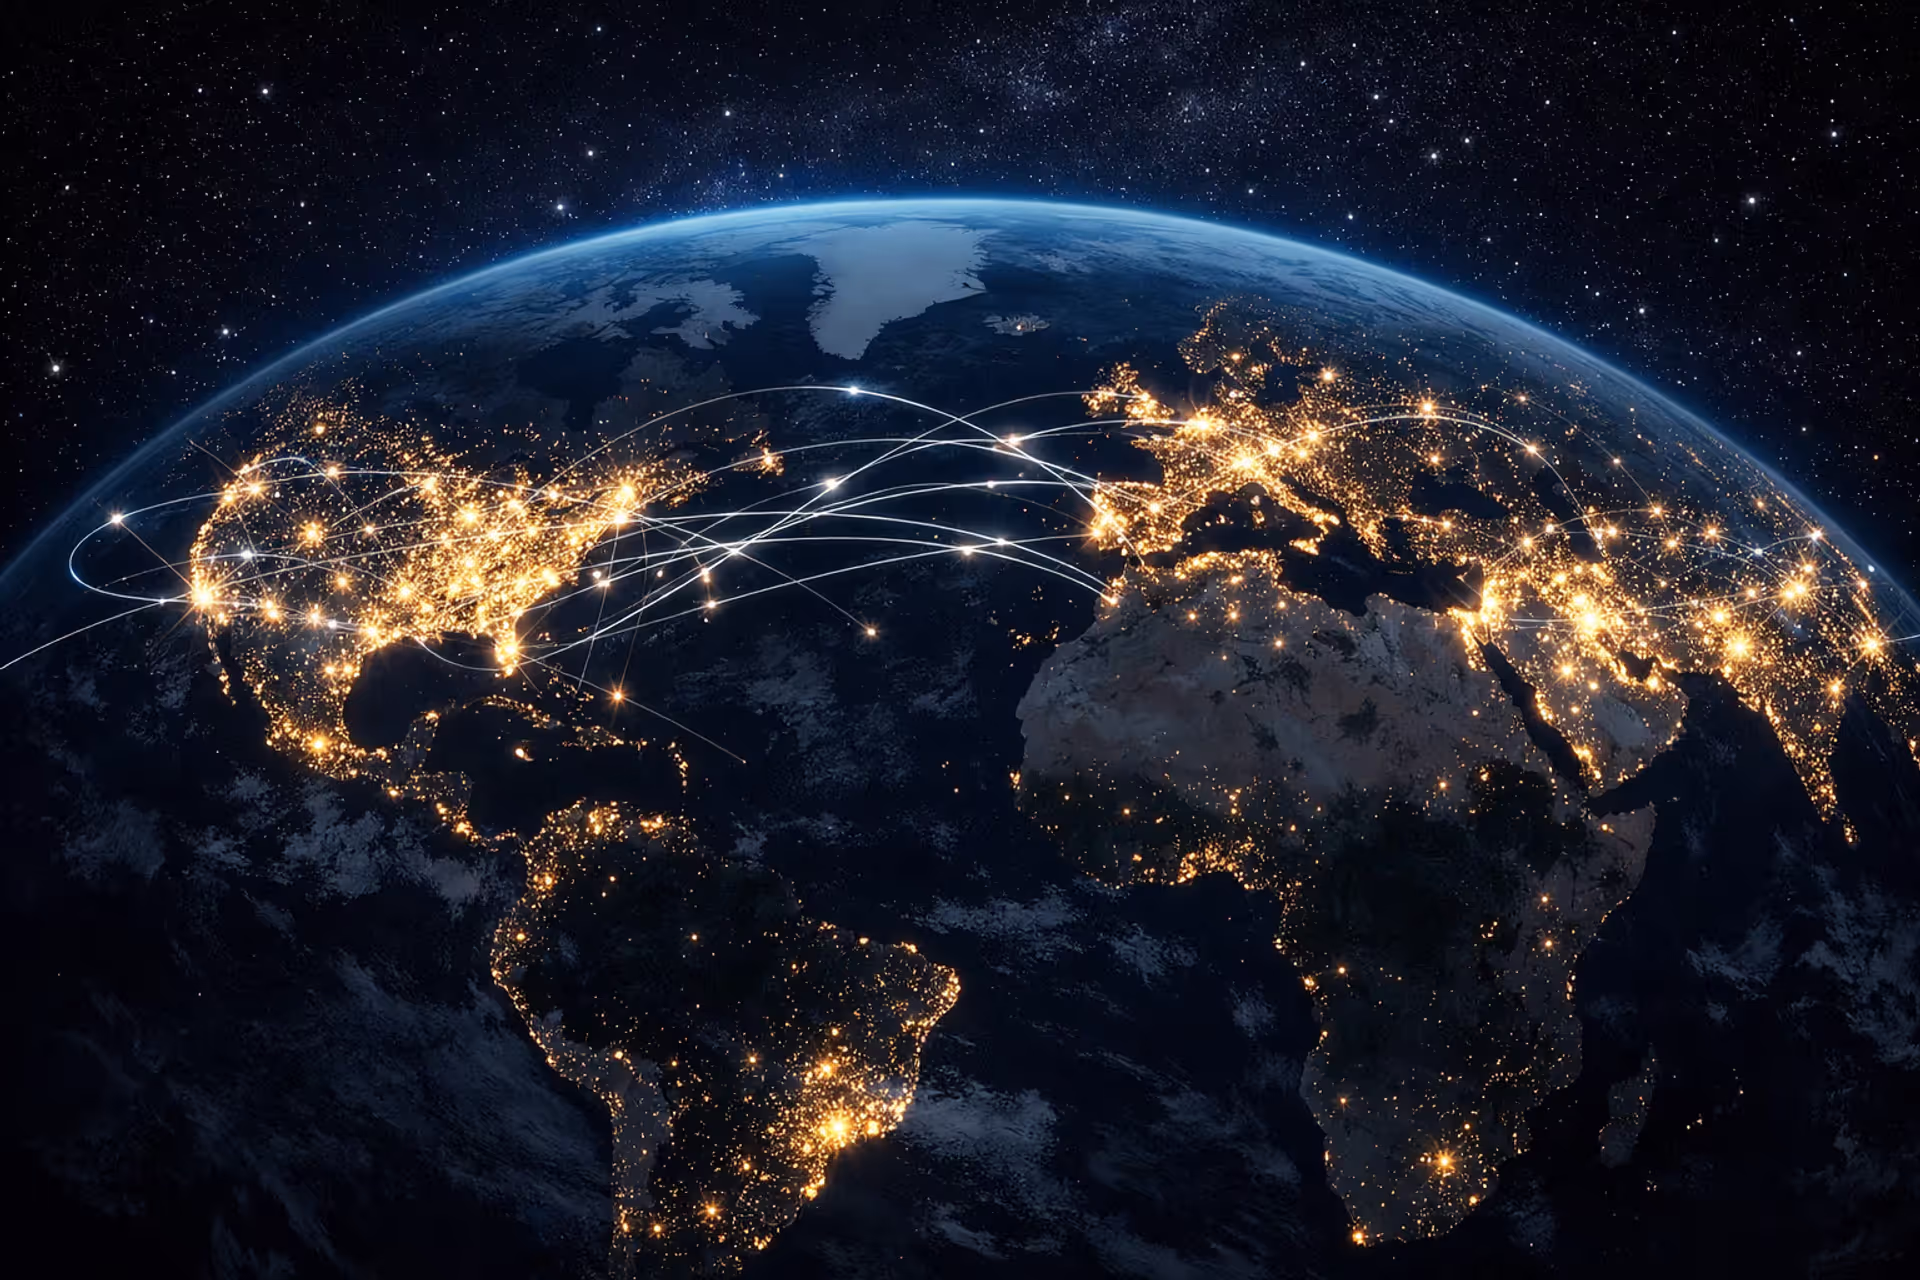
Night view of Earth from space showing illuminated internet connection nodes and city lights with visible digital divide between connected and unconnected regions
How Many People Use the Internet Worldwide

Content
Right now, 5.35 billion people have internet access. That's 66.2% of everyone on Earth—about two out of every three people.
Last year added 97 million new users to that total, which breaks down to roughly 266,000 people getting online for the first time each day. Picture a city the size of Orlando, Florida connecting every 24 hours.
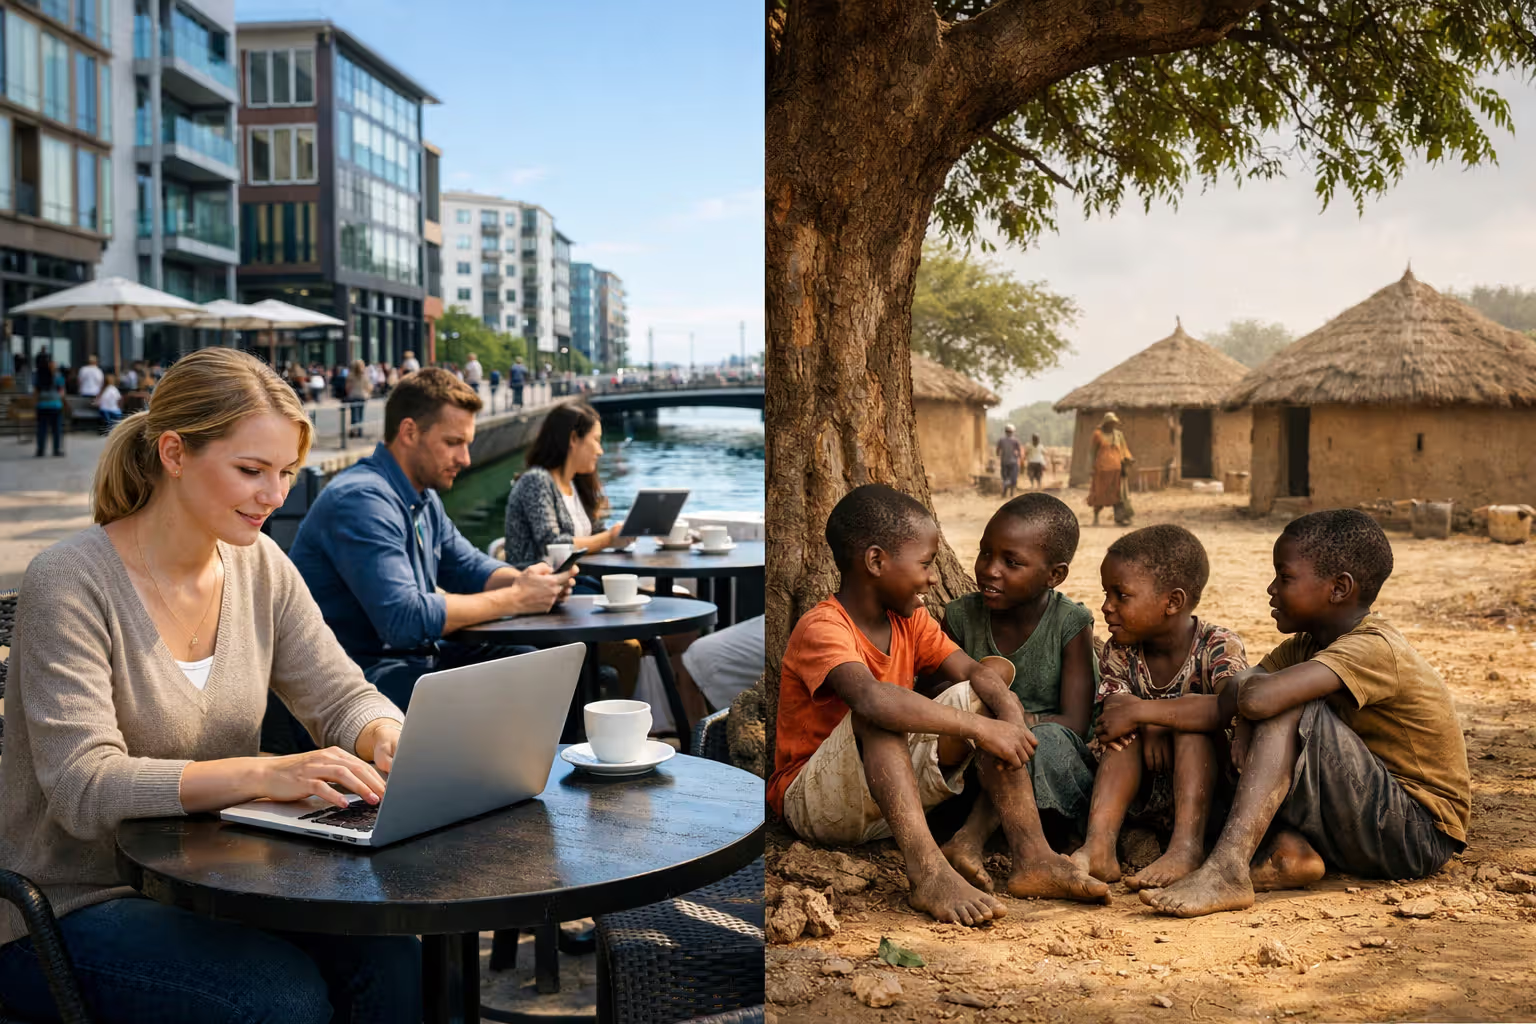
This matters more than the numbers suggest. Over half the planet can now look up medical symptoms, apply for jobs remotely, watch educational videos, or video-call relatives across oceans. But flip that statistic around: 2.7 billion people still can't do any of those things. Kids can't submit homework online. Small business owners can't reach customers beyond their village. Job seekers miss opportunities that only get posted on company websites.
The pace of growth keeps dropping. That 1.8% annual increase? Ten years ago, we routinely saw 7-10% jumps each year. The smartphone boom already swept through cities and suburbs worldwide. What's left are the hardest-to-reach populations—people in mountain villages without electricity, families who can't afford $8-per-month data plans, regions where the nearest cell tower sits 50 kilometers away.
Look at Northern Europe, where 97% of people browse the web regularly. Compare that to Central Africa at barely 30% penetration. Tech giants build their next headquarters in the first group. They largely ignore the second. Students in Oslo access university courses from MIT or Stanford. Students in rural Chad struggle to load a single Wikipedia page—if they can get online at all.
How Internet Users Are Actually Measured and Counted
Nobody really knows the exact number of internet users. Sounds strange, right? But counting billions of people across 195 countries with different tracking methods creates unavoidable uncertainty.
Author: Tyler Beaumont;
Source: flexstarsolutions.com
Data Sources: ITU, World Bank, and Private Research Firms
The International Telecommunication Union coordinates the most trusted official counts. This UN agency collects reports from national telecom regulators, internet providers, and government surveys across member states. They define a user as someone who went online at least once in the past three months, regardless of how briefly.
The World Bank pulls similar data but leans heavily on mobile subscription numbers as a stand-in for internet access. Private companies like Statista and We Are Social mix official statistics with web traffic analysis, social platform data, and mobile network reports. Their numbers come out faster—sometimes within weeks of the current month—but they're partly estimated rather than directly measured.
Each approach has trade-offs. ITU figures undergo extensive verification but typically lag 6-18 months behind real-time. It's actually based on data mostly from mid-to-late 2023. Private research firms publish more current estimates by filling gaps with modeling, which introduces potential error but provides timely snapshots.
Active Users vs. Registered Accounts: Why Numbers Vary
Here's where things get messy. Someone who checked their email once six months ago still counts as an internet user in most statistics. Meanwhile, a family of four sharing one smartphone to watch YouTube appears as just one user in mobile subscription data.
Researchers actually track several categories: people living where internet exists (theoretical access), those who've ever gone online (lifetime users), regular users who connect weekly or more, and daily active users. A teenager scrolling TikTok for three hours daily lands in the same dataset as a retiree who googles the weather forecast once a month.
Device tracking complicates matters further. Analytics companies try counting unique visitors through browser fingerprints and IP addresses, but VPNs scramble the data. China's 1.05 billion users mostly access domestic platforms like WeChat and Baidu that Western tracking tools barely measure. India's users often share devices among extended family members, creating one digital footprint for multiple people.
Some people own three SIM cards but only use one for actual internet. Others buy monthly data plans then run out halfway through and go offline until next month. Should they count as users? What about someone with home WiFi who hasn't paid their bill in two months? These edge cases add up when you're tracking billions.
Internet Penetration Rates by Region: Where Adoption Leads and Lags
Average global numbers hide massive continental differences. Northern Europe, wealthy Gulf states, and East Asian tech hubs sit at one extreme. Sub-Saharan Africa and rural South Asia occupy the other.
| Region | Total Internet Users (millions) | Penetration Rate (%) | YoY Growth (%) |
| North America | 345 | 93.4% | 0.9% |
| Europe | 727 | 87.7% | 1.1% |
| Asia-Pacific | 2,844 | 64.4% | 2.3% |
| Latin America | 522 | 78.5% | 2.8% |
| Middle East | 219 | 78.2% | 3.1% |
| Africa | 693 | 43.1% | 4.2% |
North America and Europe show what market saturation looks like. Growth barely crosses 1% because almost everyone who wants connectivity and can pay for it already has it. The remaining offline population skews older or lives in extremely remote areas where running cables costs more than the potential revenue justifies.
Asia-Pacific holds 53% of all internet users—more than half the world's online population. The two biggest contributors alone, India and China, total 2.1 billion connected people. But averages mislead: South Korea reaches 97% penetration while Afghanistan struggles to cross 20%. Jakarta's commuters stream Netflix on subway rides. Afghan villagers in Helmand Province have never seen a computer.
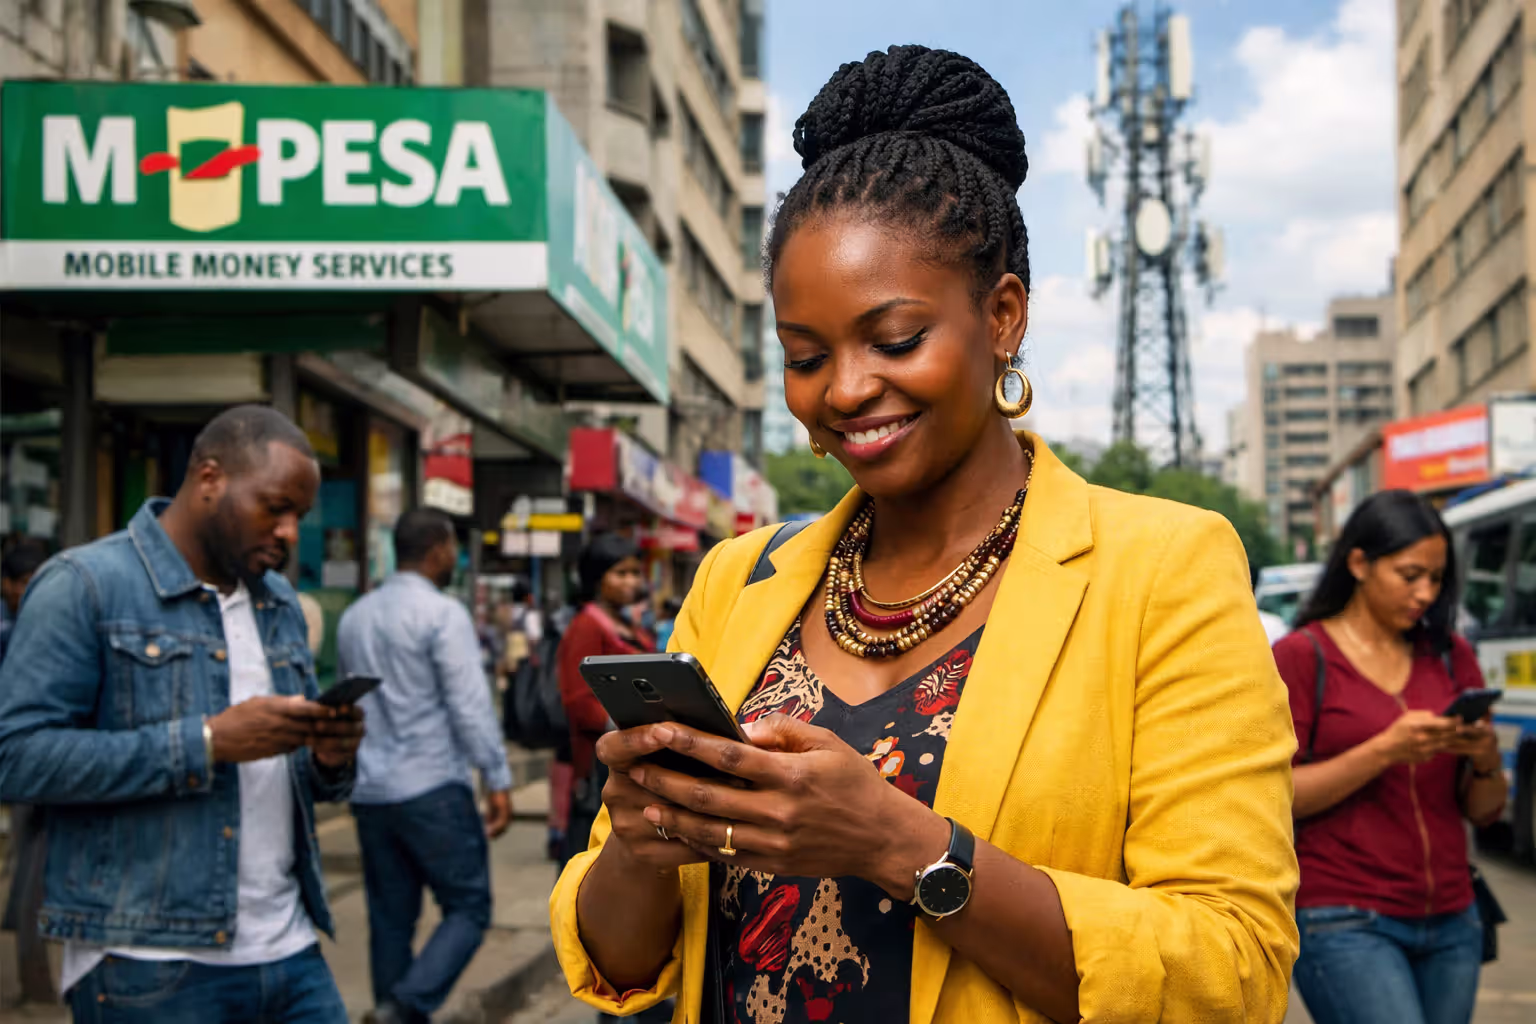
Africa represents where the growth action happens now. Despite the lowest regional penetration at 43%, it's adding users faster than anywhere else—4.2% annually. Mobile networks make this possible. Why build expensive landline infrastructure when cell towers can cover wider areas at lower cost? Nigeria connected 12 million new users last year. Kenya's mobile money systems show how leapfrog development works—people who never had bank accounts now transfer funds via smartphone.
Latin America occupies middle ground. São Paulo, Mexico City, and Buenos Aires match developed-world connectivity. Rural areas and indigenous communities face persistent gaps. That 2.8% growth rate reflects steady expansion into previously unconnected territories, though infrastructure investment hasn't kept pace with demand.
The Middle East surprises many observers. UAE and Qatar push past 99% penetration rates, driven by wealthy populations and government mandates for universal connectivity. But conflict zones like Yemen, Syria, and Iraq drag regional numbers down substantially. Millions of refugees and displaced persons lost digital access when wars destroyed infrastructure.
The Digital Divide: Who Still Lacks Internet Access and Why
Those 2.7 billion offline people aren't evenly distributed. They cluster in predictable patterns: rural residents, elderly individuals, people earning under $10 daily, women in developing nations, and those with disabilities.
Economic Barriers to Connectivity
Money remains the biggest obstacle. In wealthy countries, 1GB of mobile data costs about 0.5% of average monthly income—barely noticeable. In poor countries, that same gigabyte can eat up 20% or more of what someone earns in a month.
The cost barrier extends past data plans. Smartphones capable of running WhatsApp, Facebook, or YouTube start around $50-75. For families surviving on $3-5 per person per day, that represents months of savings.
Consider a rice farmer in rural Bangladesh earning $150 monthly. Buying a $60 smartphone plus subscribing to an $8 data plan means choosing between connectivity and necessities—food, medicine, children's school fees. Most choose the necessities. They're not technophobic or uninterested; they're broke.

Author: Tyler Beaumont;
Source: flexstarsolutions.com
Even free public WiFi doesn't solve the problem when you lack a device to connect with. Libraries and community centers in developing countries sometimes offer shared computers, but waiting hours for a 20-minute session limits usefulness.
Infrastructure Gaps in Rural and Developing Areas
Physical infrastructure creates the second major barrier. Running fiber-optic cable to a village of 200 costs the same as connecting an urban neighborhood of 20,000—but generates a fraction of the revenue. Telecom companies follow the money, which concentrates in cities.
Geography compounds the challenge. Stringing cables across the Himalayas, through the Amazon rainforest, or among thousands of Indonesian islands requires enormous capital investment with uncertain financial returns. Satellite internet like Starlink theoretically bridges these gaps, but monthly costs stay out of reach for developing-world budgets.
Electricity creates a prerequisite barrier. Around 770 million people lack reliable power. You can't charge a smartphone or power a router without electricity. Even where electrical grids exist, frequent outages in countries like Nigeria, Pakistan, or Venezuela disrupt service and damage equipment.
Political instability actively destroys infrastructure. Syria lost an estimated 60% of internet capacity during civil war—cell towers demolished, data centers destroyed, fiber networks severed. Myanmar's military regime imposed nationwide shutdowns to suppress protests. North Korea maintains near-total digital isolation as explicit state policy, with internet access limited to a tiny elite while the remaining 25 million citizens live offline by government decree.
The internet has become essential infrastructure for modern life, yet billions remain excluded. This isn't just about technology—it's about economic opportunity, education, healthcare access, and democratic participation. Bridging the digital divide must be a global development priority
— Doreen Bogdan-Martin
Gender gaps persist even in connected communities. Women in South Asia and sub-Saharan Africa are 15-37% less likely than men to use the internet. Cultural restrictions, lower literacy rates, and reduced control over household finances all contribute. A family might own one smartphone, but the husband controls it. His wife and daughters effectively remain offline despite living in a theoretically connected household.
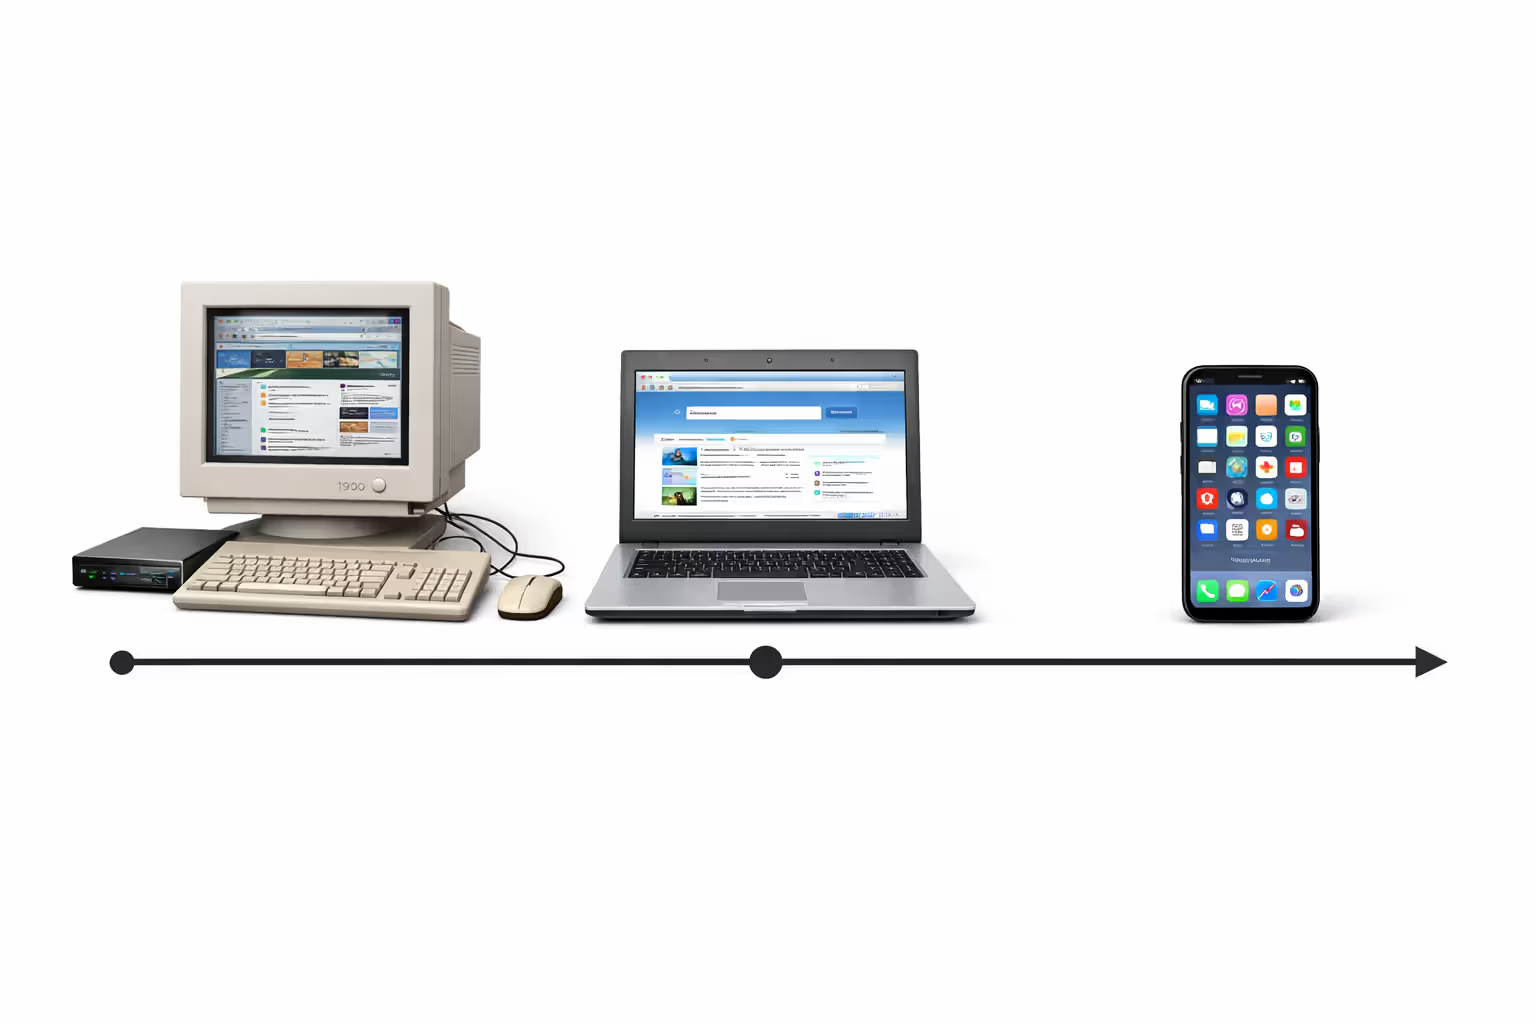
Internet Growth Trajectory: From 1990s to Present Day
The internet spread faster than almost any technology in human history. Radio took 38 years to reach 50 million users. Television needed 13 years. The internet hit that milestone in just four years during the 1990s.
| Year/Period | Estimated Users (millions) | % of World Population | Key Milestone |
| 1995 | 16 | 0.4% | Netscape and IE browsers launch |
| 2000 | 413 | 6.8% | Dot-com bubble peaks |
| 2005 | 1,024 | 15.8% | Facebook and YouTube emerge |
| 2010 | 2,023 | 29.5% | iPhone triggers smartphone era |
| 2015 | 3,193 | 43.4% | Mobile overtakes desktop globally |
| 2020 | 4,833 | 62.0% | Pandemic forces rapid digital shift |
| 2024 | 5,350 | 66.2% | AI tools become mainstream |
The 1990s saw gradual adoption concentrated in universities, government agencies, and tech companies. Dial-up connections at 56 kbps—painfully slow by today's standards—limited functionality to email, basic web pages, and text chat. Loading a single photo took minutes. Video was essentially impossible. The "information superhighway" existed more as aspirational concept than everyday reality.
Broadband arrived in the early 2000s, transforming what people could do online. Always-on connections enabled streaming music, online gaming, and e-commerce. Social networks like Friendster, then MySpace, then Facebook created new reasons to log in daily. The five years from 2000 to 2005 added over 600 million users—more than the entire preceding internet era combined.
Smartphones changed everything. Apple's 2007 iPhone launch—followed by Android's rapid spread—put internet access in billions of pockets. Markets like India, Indonesia, and Nigeria skipped desktop computers entirely, jumping straight to mobile. Young people in Lagos or Mumbai experienced the internet first on 5-inch screens, not desktop monitors. Between 2010 and 2015, user counts jumped by 1.17 billion, driven overwhelmingly by mobile adoption.
COVID-19 forced digital transformation into hyperdrive. Remote work, distance learning, telemedicine, and e-commerce shifted from optional to mandatory overnight. Countries that had postponed infrastructure upgrades scrambled to expand capacity. Zoom's daily meeting participants exploded from 10 million to 300 million in four months. The pandemic years added roughly 800 million users—many who might've stayed offline another 5-10 years under normal circumstances.
Current growth concentrates in Africa and South Asia, where hundreds of millions still await first connectivity. Reaching them will prove far harder than connecting the first 5 billion. They're offline precisely because they're the most difficult and expensive populations to serve.
Author: Tyler Beaumont;
Source: flexstarsolutions.com
What Drives Internet Adoption Rates in Different Countries
Why does South Korea have 97% internet penetration while neighboring North Korea has essentially zero? National connectivity rates reflect interactions between economic development, government policy, geography, and cultural factors.
Wealth matters, obviously. Richer countries afford better infrastructure and their citizens can pay for devices and data plans. But the relationship isn't perfectly linear. Vietnam achieves 77% penetration with GDP per capita around $4,100 through aggressive infrastructure investment and mobile-first policies. Meanwhile, some oil-rich but poorly-governed nations underperform their wealth level.
Government policy choices make enormous differences. South Korea's early 2000s universal broadband commitment created world-class infrastructure that still leads globally. Estonia made internet access a legal right and digitized government services, driving adoption. China's top-down investment in 5G infrastructure connected hundreds of millions despite lower per-capita income than Western nations. Conversely, countries maintaining state telecom monopolies or imposing heavy taxes on devices and data suppress adoption rates below their economic potential.
Mobile-first strategies enable rapid expansion where fixed-line infrastructure never existed. Why spend billions on telephone poles and copper wires when cell towers cover wider areas faster and cheaper? Kenya's M-Pesa mobile money system demonstrated how cellular networks could deliver sophisticated digital services to populations that never had landline phones or bank accounts. This leapfrog model now dominates growth strategies across Africa and South Asia.
Author: Tyler Beaumont;
Source: flexstarsolutions.com
Age demographics shape adoption patterns significantly. Countries with young populations—lots of people under 30—generally show higher internet usage because digital natives grew up with connectivity as normal. Japan and Italy, with aging populations, see slower adoption despite high incomes and excellent infrastructure. Older generations adopt technology more gradually, regardless of availability.
Literacy creates a foundational requirement. Internet use demands reading ability, even for video or voice-based services. Countries with low functional literacy struggle with adoption regardless of infrastructure. Voice interfaces and visual apps help, but text still dominates most online activities. Someone who can't read misses most of what makes the internet valuable.
Language availability affects how much value people extract from connectivity. English speakers access the vast majority of online content, apps, and services. Speakers of smaller languages find limited relevant material in their native tongue. This creates second-tier digital citizens who technically have internet but derive less benefit because most content remains inaccessible linguistically.
Regulatory environments around privacy, content rules, and platform competition shape user experiences dramatically. The European Union's strict GDPR data protections differ massively from China's state surveillance model or America's hands-off market approach. These policy choices influence both adoption rates and usage patterns in complex ways.
Frequently Asked Questions About Global Internet Usage
Two-thirds of humanity now has internet access—an achievement unimaginable just 30 years ago when Tim Berners-Lee invented the World Wide Web. But that final third presents challenges far tougher than the first two-thirds faced.
Early adopters lived in wealthy countries with existing telephone networks that could be upgraded. They could afford computers and monthly bills. The infrastructure challenge involved improving what already existed, not building from scratch. Those still offline today face poverty, geographic isolation, political instability, and systemic barriers that simply deploying more technology can't solve alone.
Understanding current internet user counts requires looking past headline numbers. Regional disparities matter. Measurement methodologies matter. The lived experience of billions who remain disconnected matters most of all. A grandmother in rural Mozambique without electricity faces completely different barriers than a teenager in suburban Detroit who just can't afford a data plan.
The digital divide won't close automatically through market forces. Telecom companies rationally avoid expensive infrastructure investments in areas with low profit potential. Bridging the gap demands coordinated efforts: infrastructure subsidies for underserved regions, affordability programs bringing costs within reach of low-income families, digital literacy training, local-language content creation, and policy frameworks treating connectivity as essential infrastructure like roads or electricity.
The next billion internet users will come online differently than previous billions. They'll connect through mobile devices, not computers. They'll access local-language content on regional platforms, not English-dominated websites. They'll use connectivity for economic survival—mobile banking, agricultural price information, distance education—rather than entertainment. Recognizing these patterns helps policymakers, businesses, and development organizations target interventions where they'll make the biggest impact on closing the global connectivity gap.